State of Preschool
Georgia
Access Rankings
4-year-Olds
9
3-year-Olds
None Served
Resource Rankings
State spending
25
All reported spending
33
Total Benchmarks Met
Of 10 benchmarks possible
8*
Overview
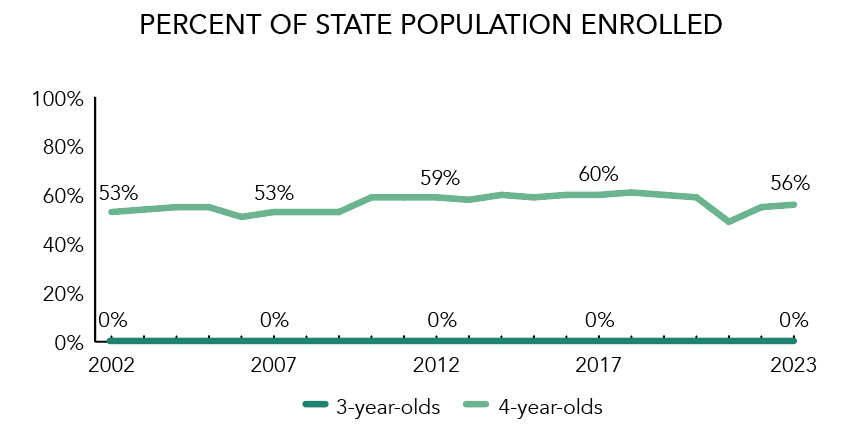
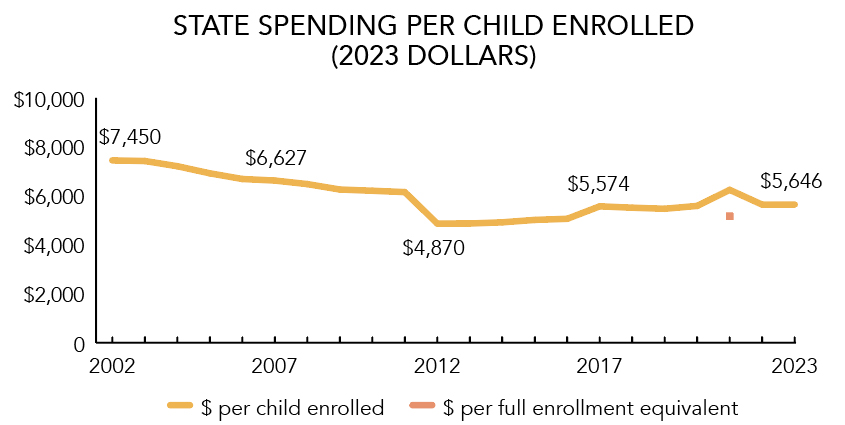
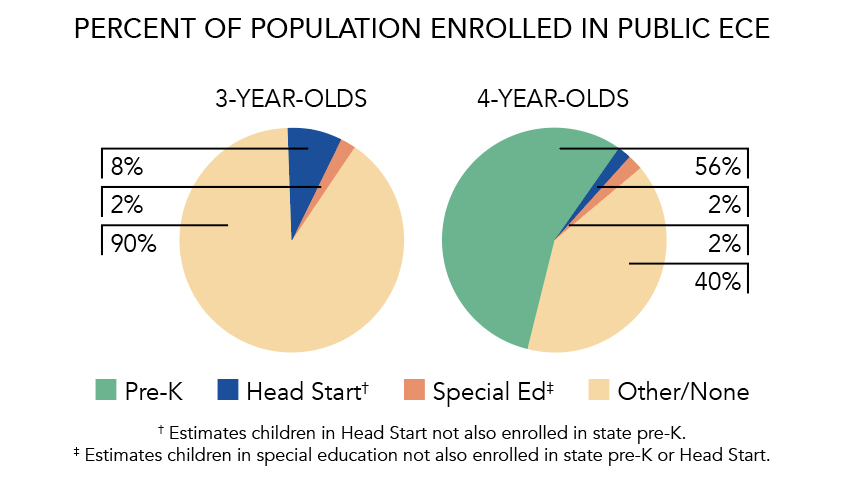
During the 2022-2023 school year, Georgia preschool enrolled 73,462 children, an increase of 285 from the prior year. State spending totaled $388,314,860, and an additional $26,471,608 in federal recovery funds supported the program, up $1,902,930 (0.5%), adjusted for inflation, since last year. State spending per child (including federal recovery funds) equaled $5,646 in 2022-2023, up $4 from 2021-2022, adjusted for inflation. Georgia met 8 of 10 quality standards benchmarks.
What's New
The final report from the Georgia Pre-K Longitudinal Study was released in spring 2023 and followed a statewide sample of 1,169 children from pre-K through fourth grade. Fourth grade results reveal that while students continued to gain skills and perform at or above the national average, most skills were not acquired as quickly as in pre-K and kindergarten. Children who had attended Georgia pre-K had better language, literacy, and executive function in fourth grade compared to children who did not attend any pre-K. Overall, results suggest that a key strength of Georgia’s Pre-K Program is building foundational literacy skills for reading.
Background
Georgia’s Pre-K Program launched in 1992 as a small pilot program and expanded in 1995 to become the nation’s first state-funded universal preschool program for 4-year-olds. State lottery revenues generate funding for the program, which is provided in a variety of settings, including public schools, private child-care centers, faith-based organizations, Head Start agencies, state colleges and universities, and military facilities.
In 2011, the Georgia General Assembly authorized an evaluation of Georgia’s Pre-K Program. In response to the General Assembly, DECAL commissioned national experts at the Frank Porter Graham Child Development Institute at the University of North Carolina at Chapel Hill to conduct a series of studies to measure the impact of the state’s nationally renowned pre-K program. Reports and summaries from the studies are available here.
Reports include recent results from the Pre-K Longitudinal Study designed to examine the short- and long-term learning outcomes for children who attended Georgia’s Pre-K as well as the quality of their preschool and early elementary school experiences. The report from the fifth year of the study was issued in January 2021. The final report with findings through the fourth grade was issued in spring 2023.
Georgia's Pre-K Program
Access
| |
| Total state pre-K enrollment | 73,462 |
| School districts that offer state program | 100% (counties) |
| Income requirement | No income requirement |
| Minimum hours of operation | 6.5 hours/day; 5 days/week |
| Operating schedule | School or academic year |
| Special education enrollment, ages 3 and 4 | 9,557 |
| Federally funded Head Start enrollment, ages 3 and 4 | 16,875 |
| State-funded Head Start enrollment, ages 3 and 4 | 0 |
Resources
| Total state pre-K spending | $414,786,468 |
| Local match required? | No |
| State Head Start spending | $0 |
| State spending per child enrolled | $5,646 |
| All reported spending per child enrolled* | $5,646 |
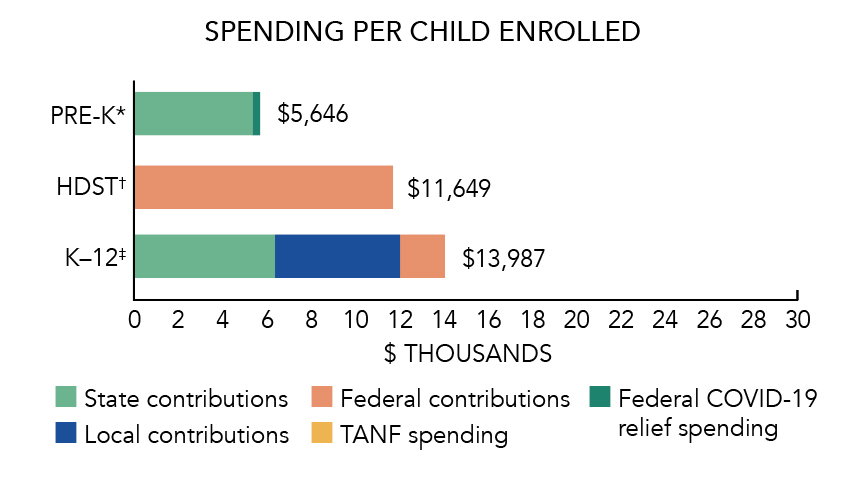
*Pre-K programs may receive additional funds from federal or local sources that are not included in this figure. †Head Start per-child spending includes funding only for 3- and 4-year-olds. ‡K–12 expenditures include capital spending as well as current operating expenditures.
Georgia Quality Standards Checklist
| Policy | Requirement | Benchmark | Meets Benchmark? |
|---|---|---|---|
For more information about the benchmarks, see the Executive Summary and the Roadmap to State pages. | 8benchmarks met | ||
| Early Learning & Development Standards Benchmark | Comprehensive, aligned, supported, culturally sensitive | Comprehensive, aligned, supported, culturally sensitive | |
| Curriculum Supports Benchmark | Approval process & supports | Approval process & supports | |
| Teacher Degree Benchmark | BA* | BA | |
| Teacher Specialized Training Benchmark | ECE, CD, ECE SpEd | Specializing in pre-K | |
| Assistant Teacher Degree Benchmark | CDA | CDA or equivalent | |
| Staff Professional Development Benchmark | 15 hours/year; PD plans; Coaching | For teachers & assistants: At least 15 hours/year; individual PD plans; coaching | |
| Maximum Class Size Benchmark | 22 (4-year-olds) | 20 or lower | |
| Staff to Child Ratio Benchmark | 1:11 (4-year-olds) | 1:10 or better | |
| Screening & Referral Benchmark | Vision, hearing, health & more | Vision, hearing & health screenings; & referral | |
| Continuous Quality Improvement System Benchmark | Structured classroom observations; Data used for program improvement | Structured classroom observations; data used for program improvement | |