State of Preschool
California
Access Rankings
4-year-Olds
18
3-year-Olds
16
Resource Rankings
State spending
5
All reported spending
5
Total Benchmarks Met
Of 10 benchmarks possible
4.5
Overview
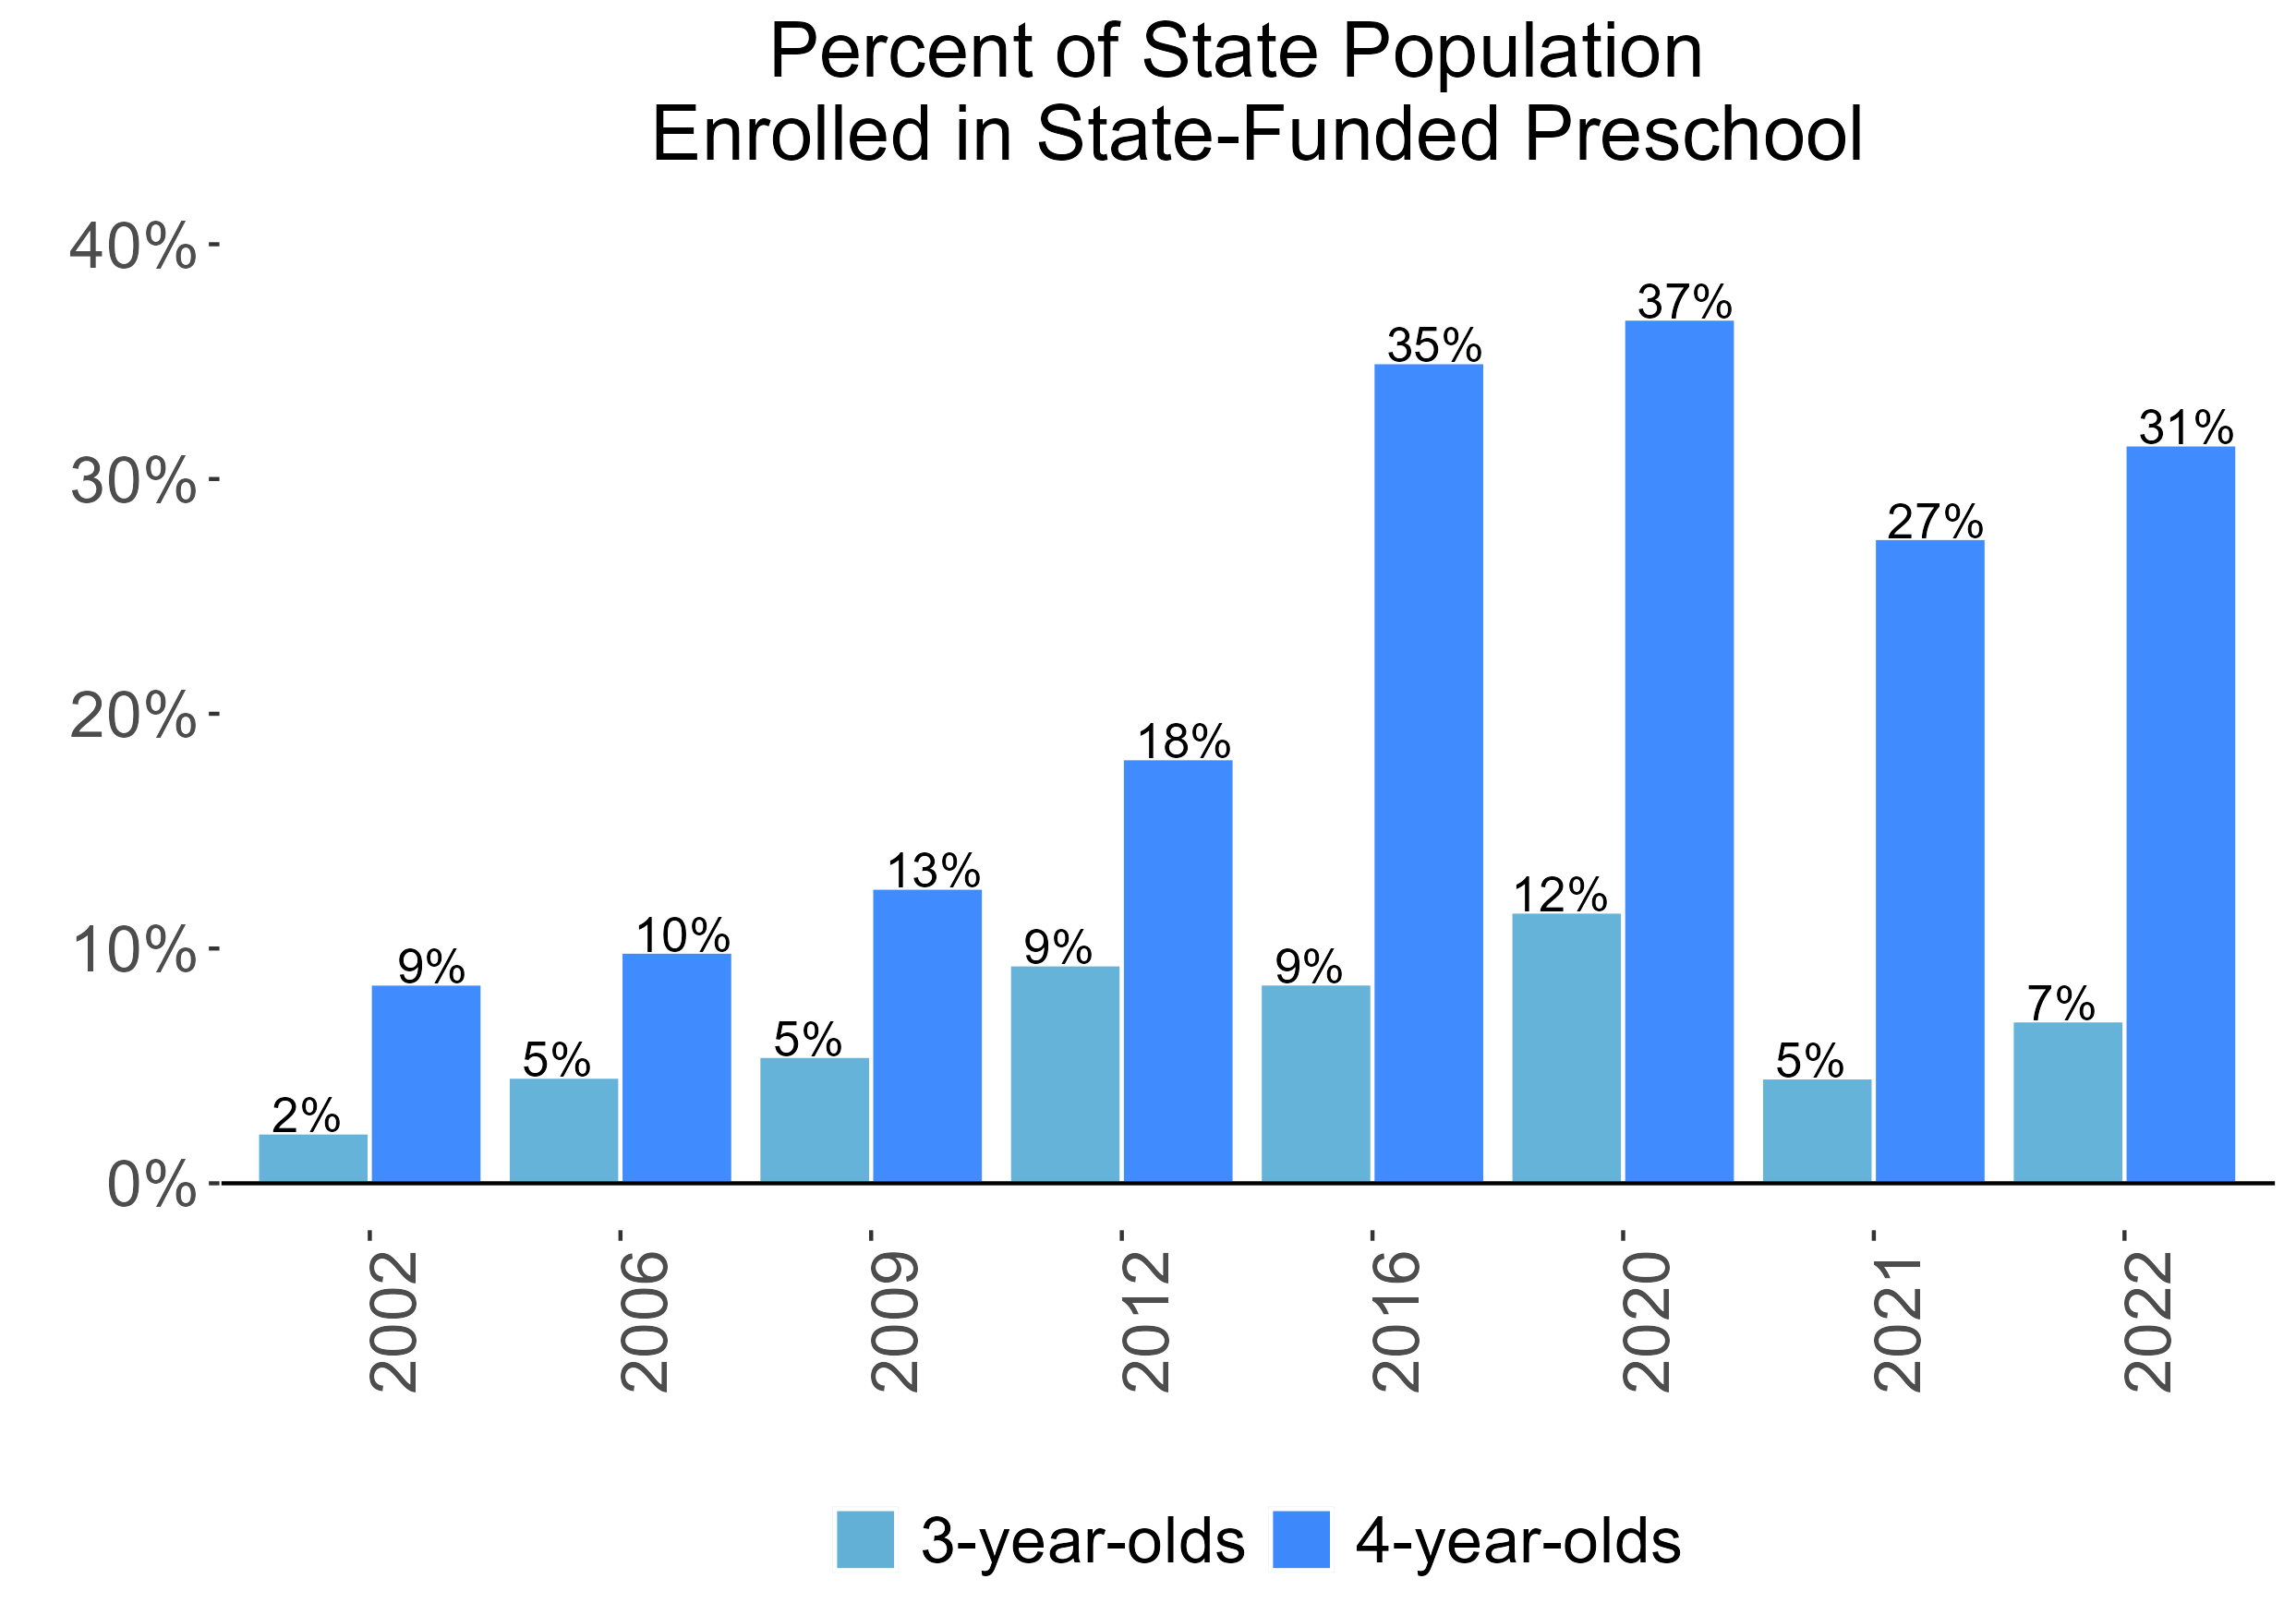
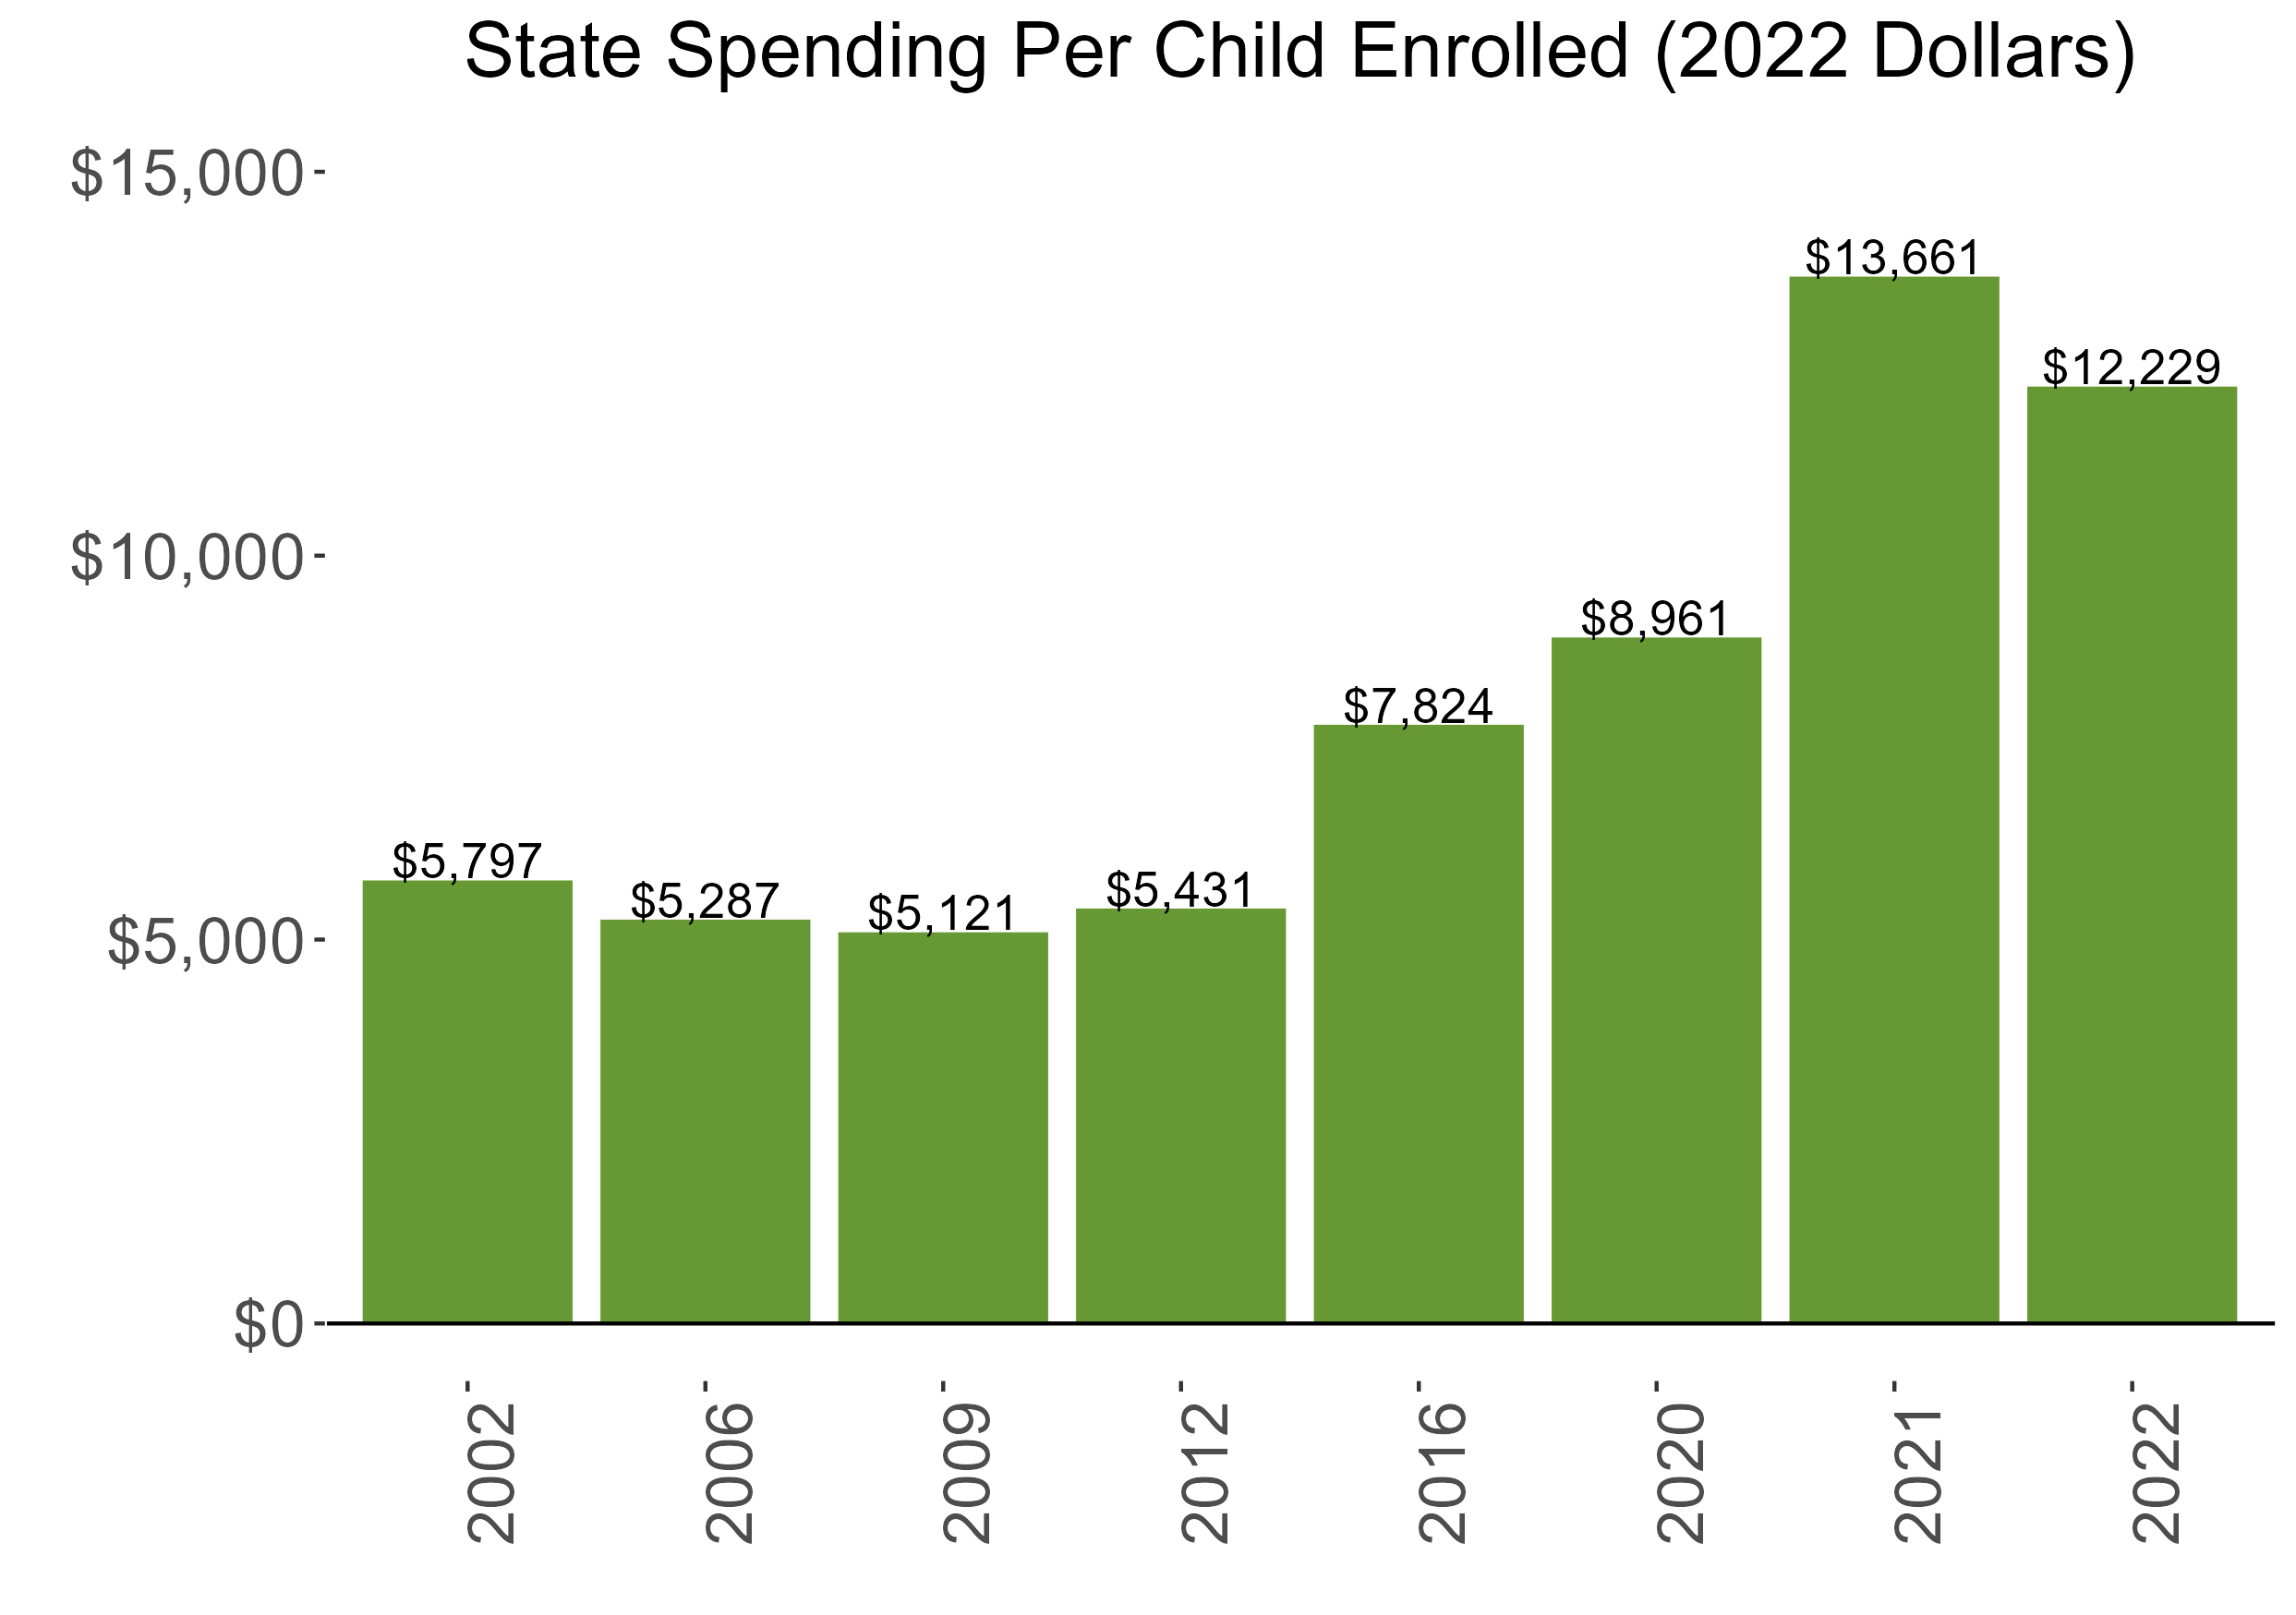
During the 2021-2022 school year, California’s two preschool programs together enrolled 181,614 children, an increase of 24,508 from the prior year, as the programs began to recover from the impact of the COVID-19 pandemic. State spending for the two programs totaled $2,129,230,104, with an additional $91,647,019 in federal recovery funds to support the program, up $74,622,274 (3%), adjusted for inflation since last year. State spending per child (including federal recovery funds) averaged $12,229 in 2021-2022, down $1,433 from 2020-2021, adjusted for inflation. In 2021-2022, state spending per child was $13,585 (including federal recovery funds) for the California State Preschool Program (CSPP) and $10,822 for the Transitional Kindergarten (TK) program. The CSPP met 6 of 10 quality standards benchmarks and TK met 3 of 10.
What's New
California State Preschool Programs (CSPP) received additional funding to cover family fee waivers through the 2022-2023 school year. Legislation signed into law in July 2021 raised CSPP reimbursement rates and CSPP programs will be held harmless if they have to close due to COVID-19. California published its Master Plan for Early Learning and Care (MPELC) in December 2020. The MPELC seeks to promote school readiness by recommending the expansion of a mixed-delivery system, increased access for three-year-olds, and universal preschool for all four-year-olds.
California is implementing universal prekindergarten (UPK) by funding a $130 million expansion of CSPP to local educational agencies and phasing in implementation of universal transitional kindergarten (UTK). In 2022, the Universal Prekindergarten Planning and Implementation Grant Program allocated $200 million to local educational agencies (LEAs) to support planning and implementation costs to expand access to classroom-based prekindergarten programs at LEAs, and $100 million supported a competitive Early Education Teacher Development Grant program for LEAs to increase the supply of highly qualified teachers. TK quality improvements are beginning to be implemented. This school year, school districts and charter schools must maintain an average TK class enrollment of no more than 24 students per school site. Beginning in 2022-2023, TK will expand by increasing the age-eligibility window until the program is fully universal by 2025-2026. Starting with the 2022-2023 school year, there must be an average ratio of 1 adult to 12 students in TK classrooms at each school site. Commencing with the 2023-2024 school year, the TK classrooms must have an average ratio of 1 adult to 10 students, contingent upon additional funding.
In December 2022, the California Health & Human Services Agency received a Preschool Development Grant Birth through Five (PDG B–5) planning grant for $4 million to include expanded activities from existing partners of PDG B–5 renewal grant, supportive resources for the Early Childhood Integrated Data System project and a new PDG B–5 California Department of Social Services team member to focus on Workforce Development and support PDG B–5 activities. PDG B–5 partners will also be funded to implement their Equity Needs Assessment recommendations with Dr. Iheoma Iruka and Dr. Shantel Meek.
Background
In 2008, the California State Preschool Program Act created the CSPP by consolidating several early childhood initiatives into one funding stream. CSPP provides part- and full-day preschool to 3- and 4-year-olds. In addition to meeting eligibility requirements for CSPP, families are prioritized for full-day services if they have established at least one of the following: employment/seeking employment, education or vocational training, homelessness, or parental incapacity.
CSPP awards funding through a competitive application process to school districts, private and faith-based agencies, Head Start programs, higher education institutions, counties, cities, and tribal organizations. Children must remain eligible throughout the year to receive full-day services but can remain in part-day programs regardless of changes to eligibility. Teachers are required to have California Child Development Associate Teacher Permits and can receive grants for professional learning. CSPP classrooms receive structured quality observations using the ECERS-R at least once a year.
California TK began during the 2012-2013 school year when the kindergarten age eligibility shifted from December 2 to September 1. TK is the first year of a two-year kindergarten program for children born between September 2 and December 2. In June 2015 an amendment to state law allowed children turning 5 years old after December 2 to attend TK at the beginning of the school year, at the discretion of the local educational agency. TK follows kindergarten law for class size, teacher qualifications, program standards, funding, and serving English language learners. By the 2025-2026 school year, TK will be available to all 4-year-olds in the state.
Beginning in the 2018-2019 school year, CSPP- and TK-enrolled children can be served in the same classroom. Classrooms consisting of commingled CSPP and TK children are intended to support student transition, allow school districts and charter schools to braid funding streams, and support the overall quality of the programs by requiring that standards from both programs are met.
-
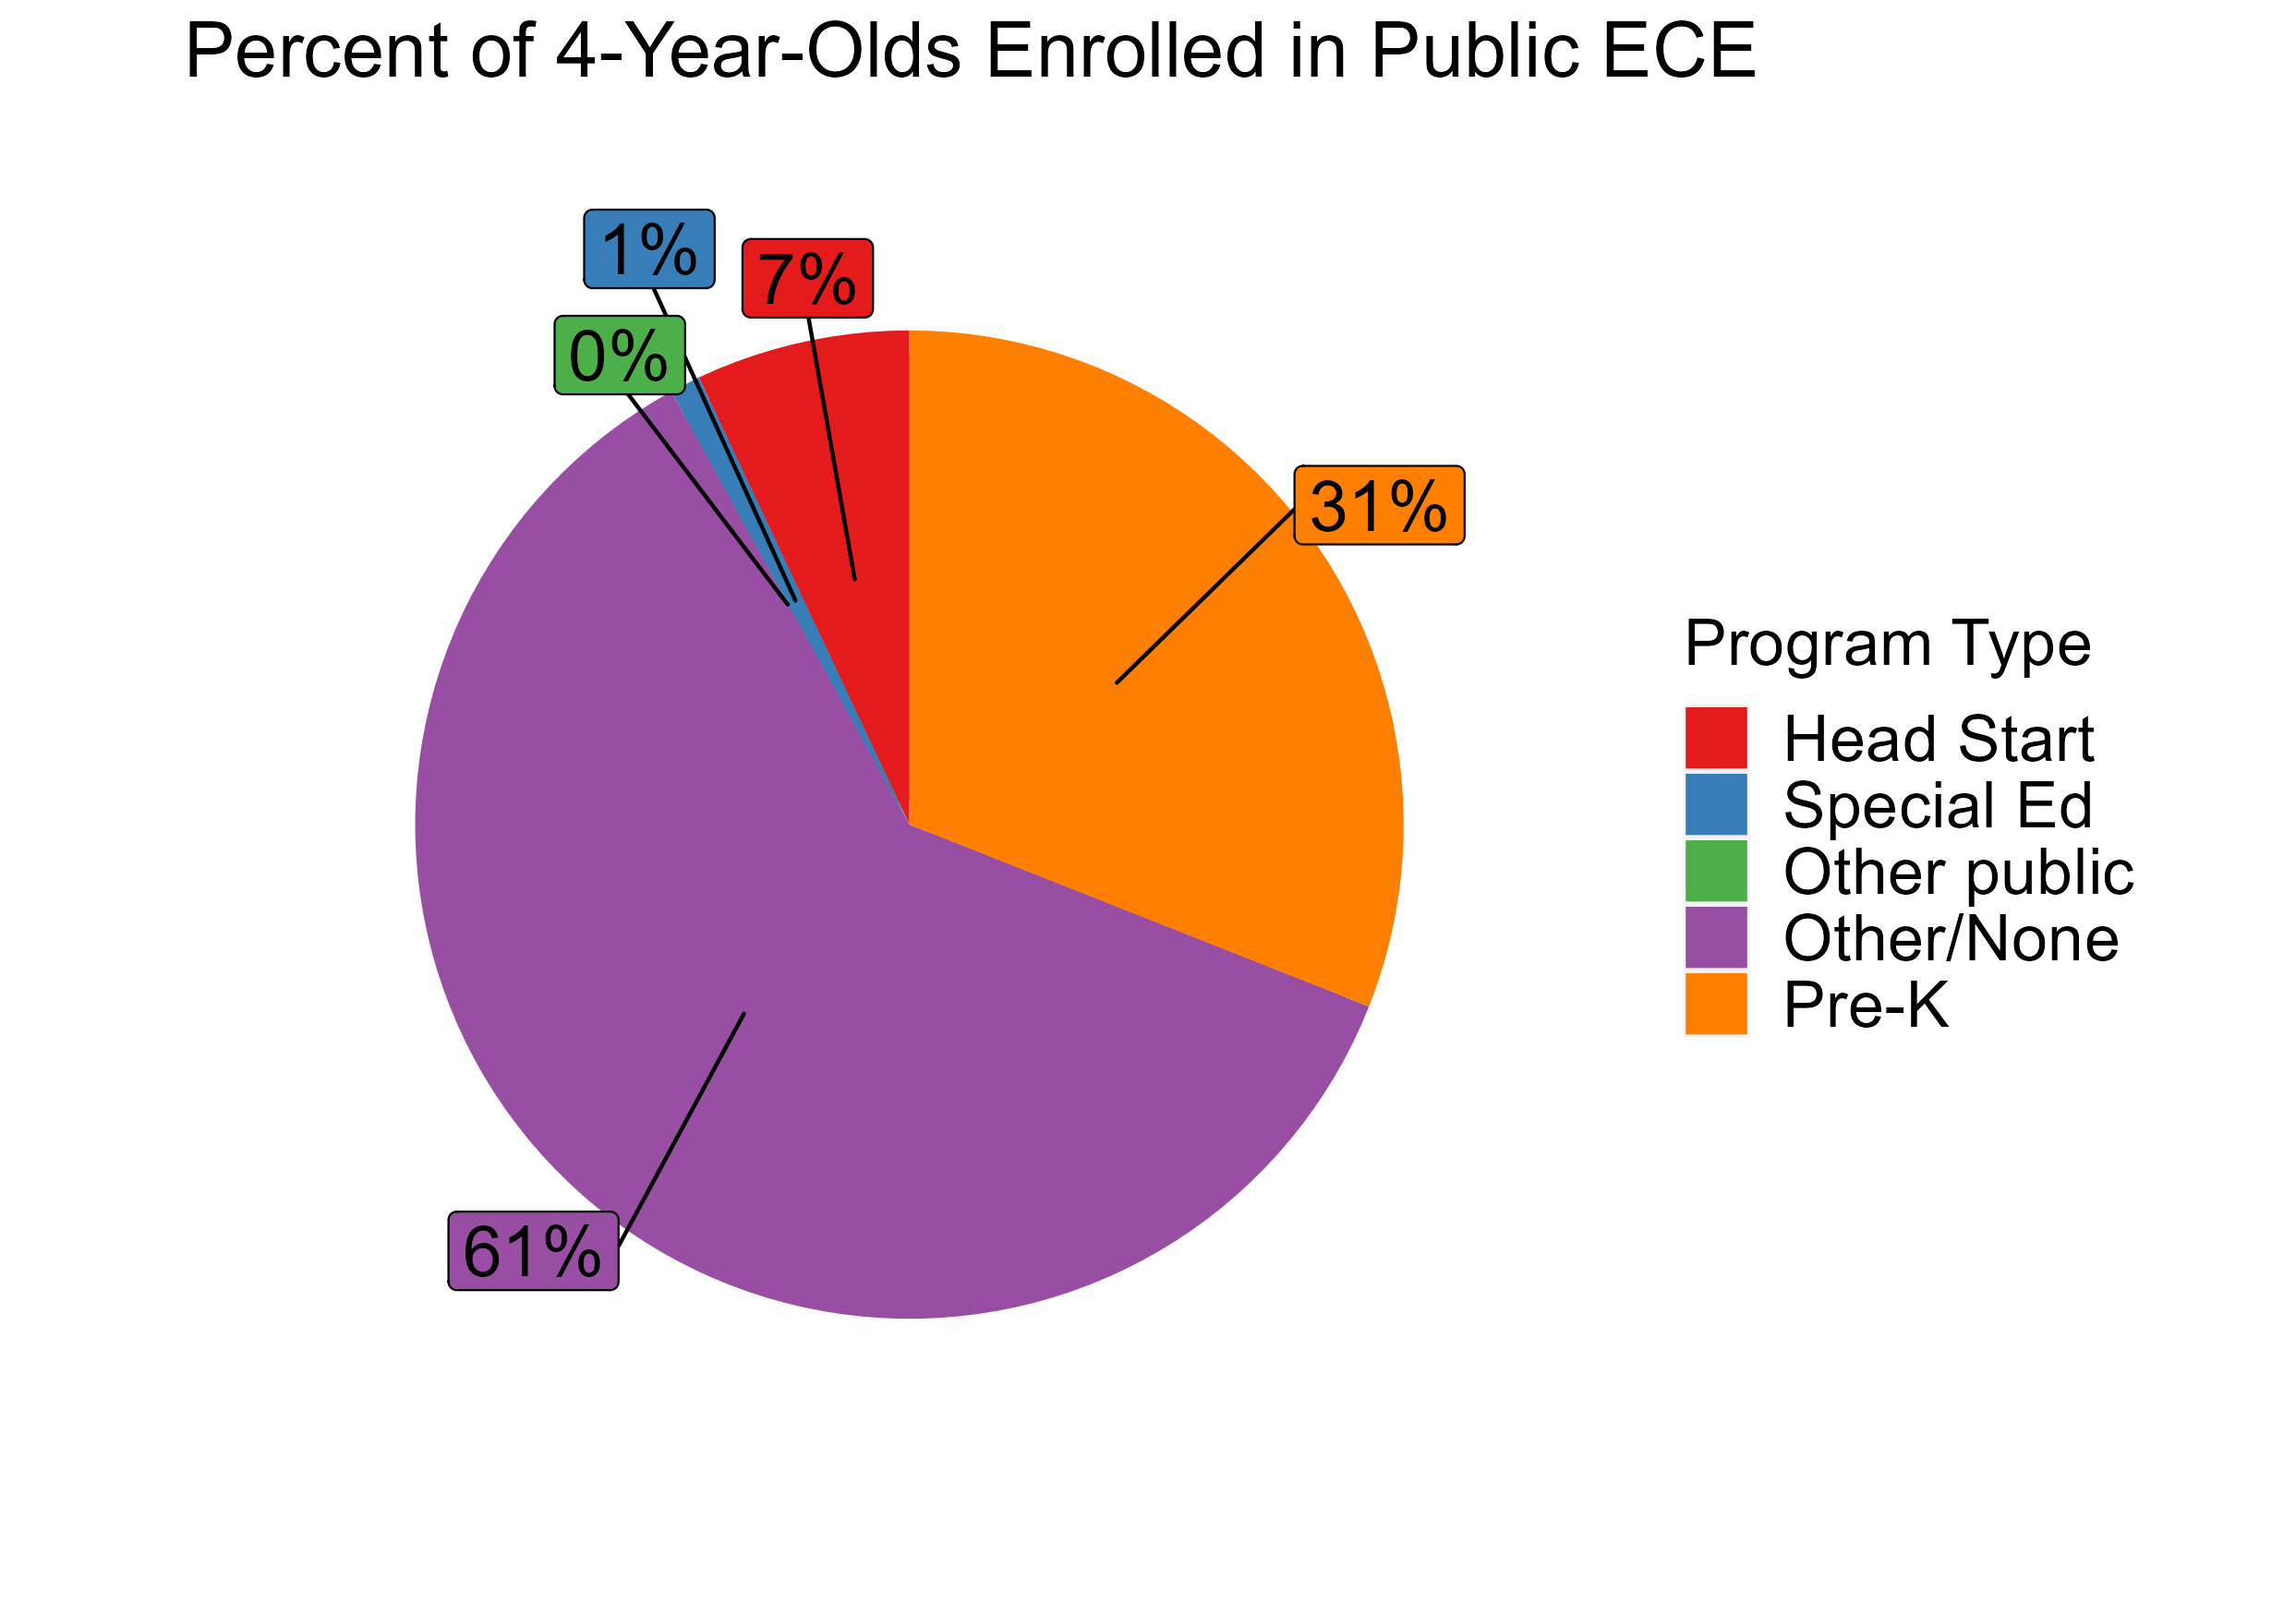
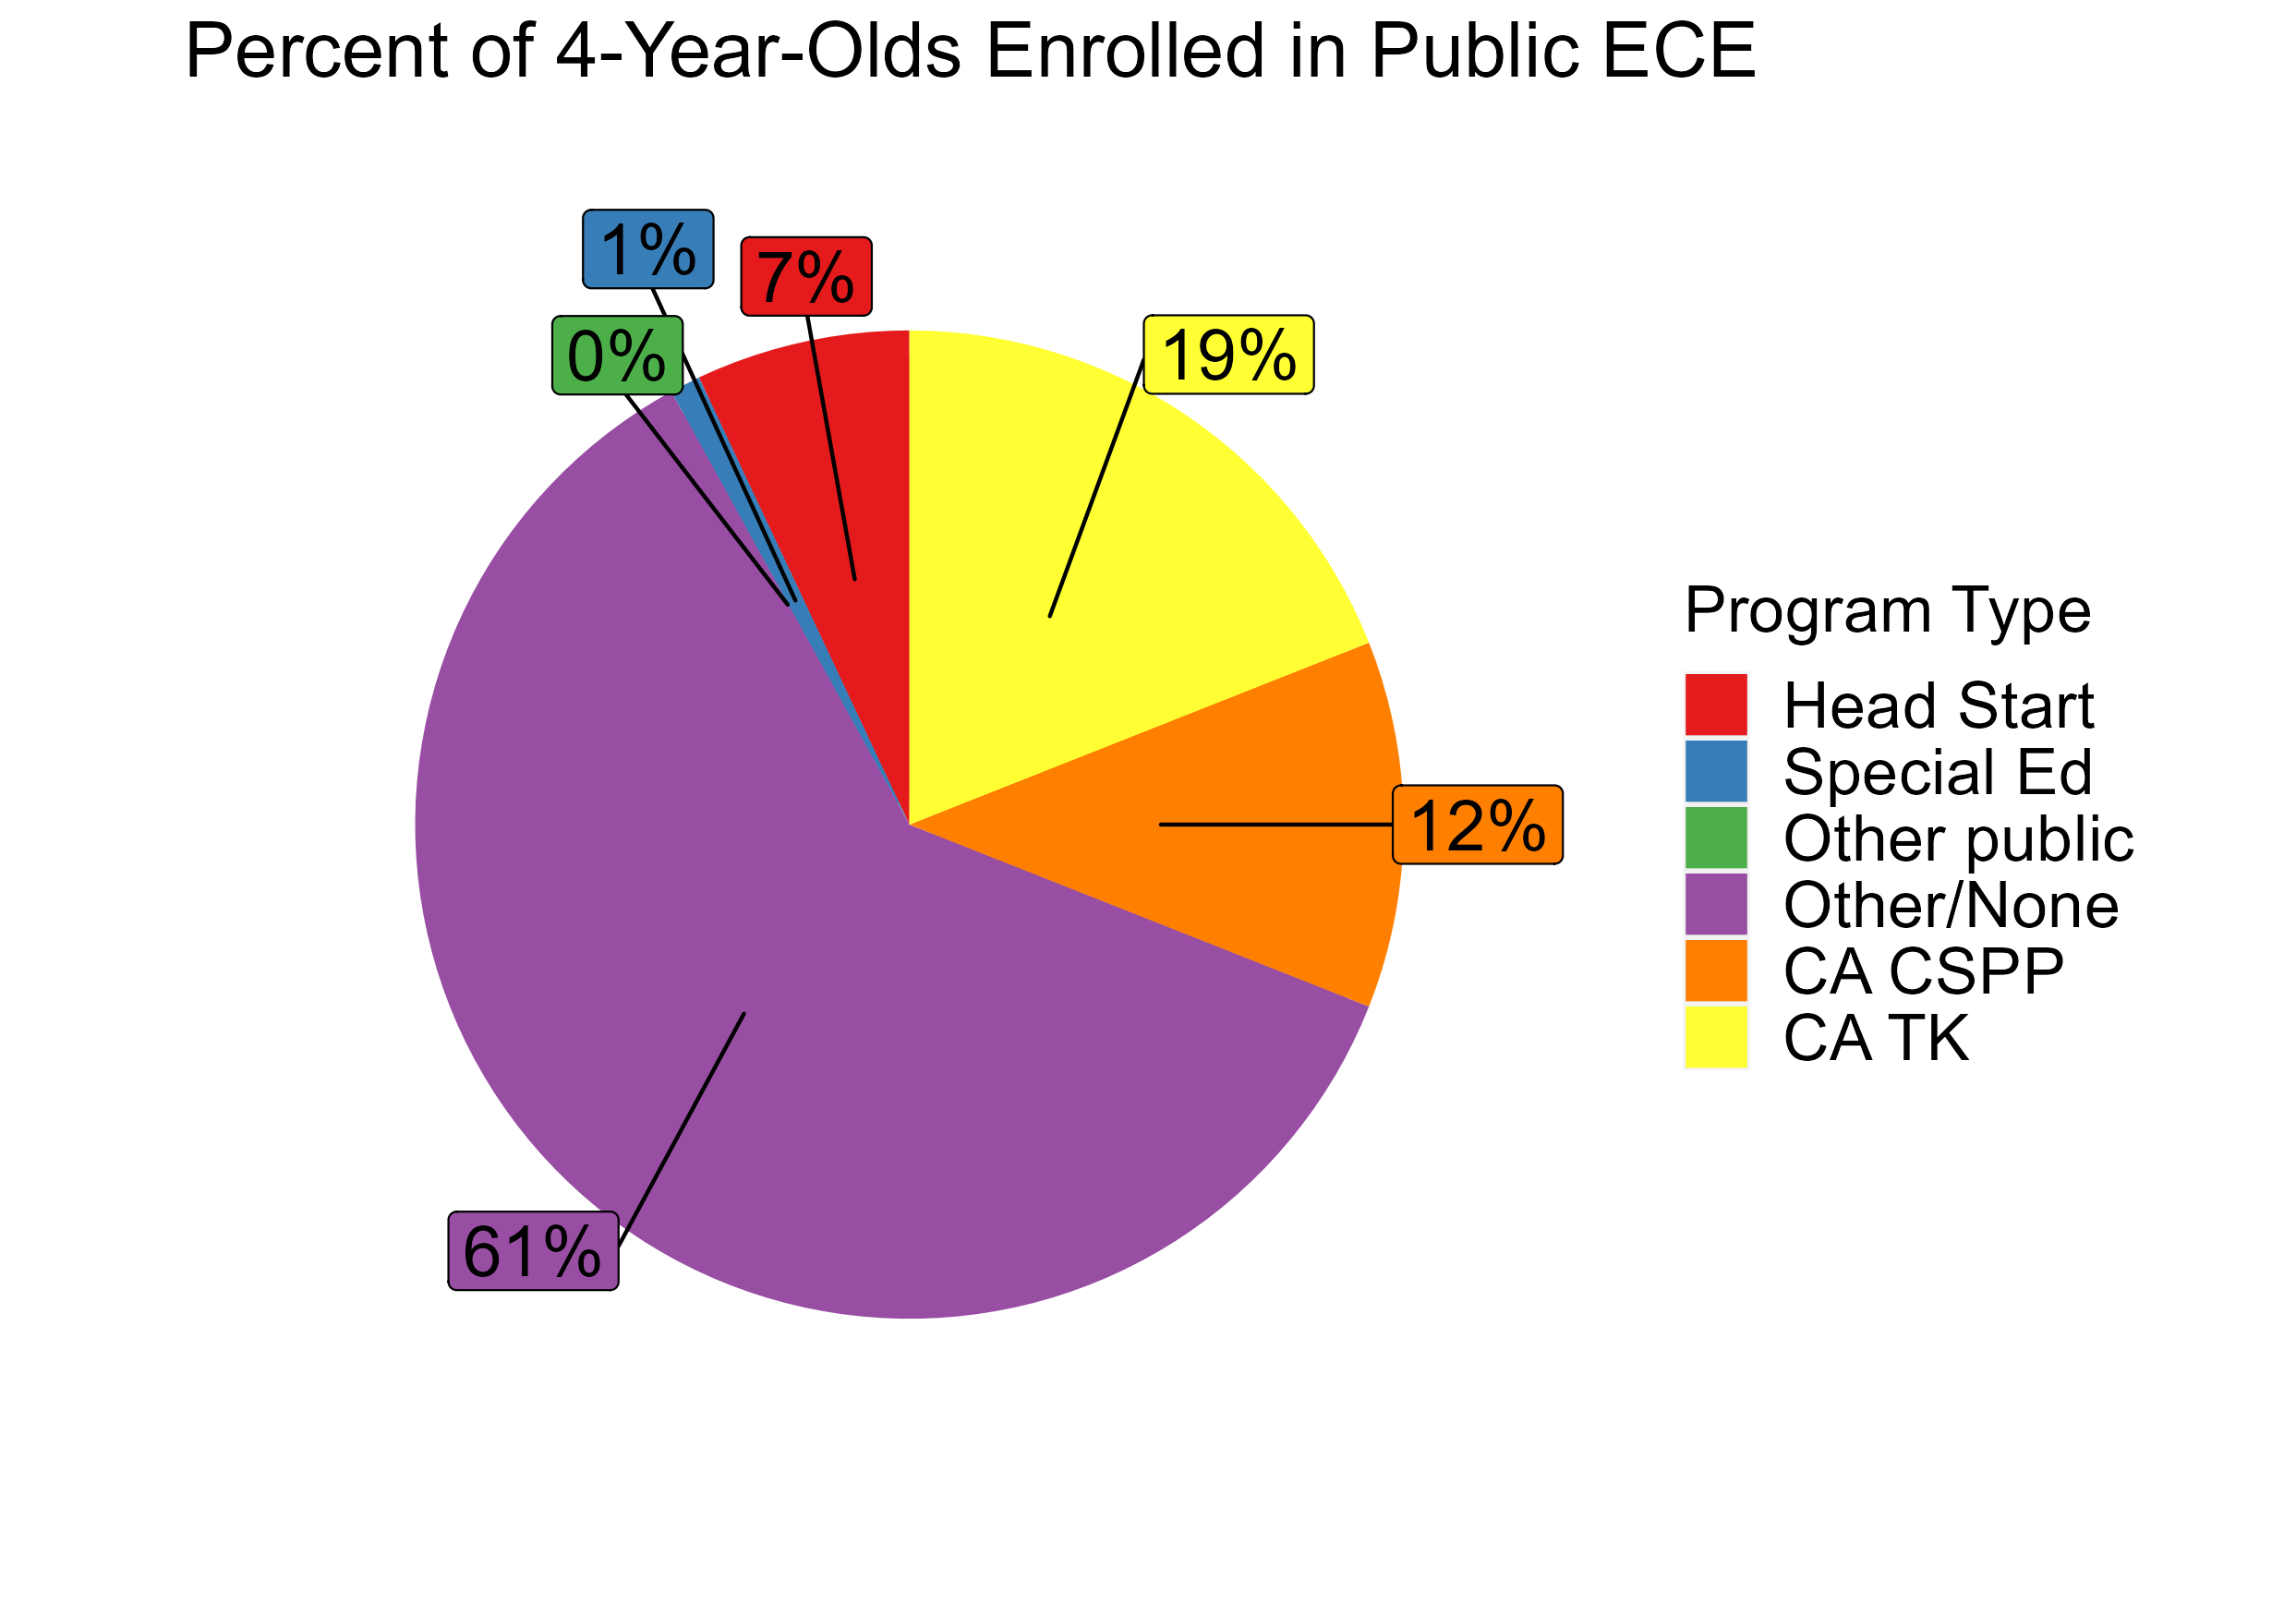
Access


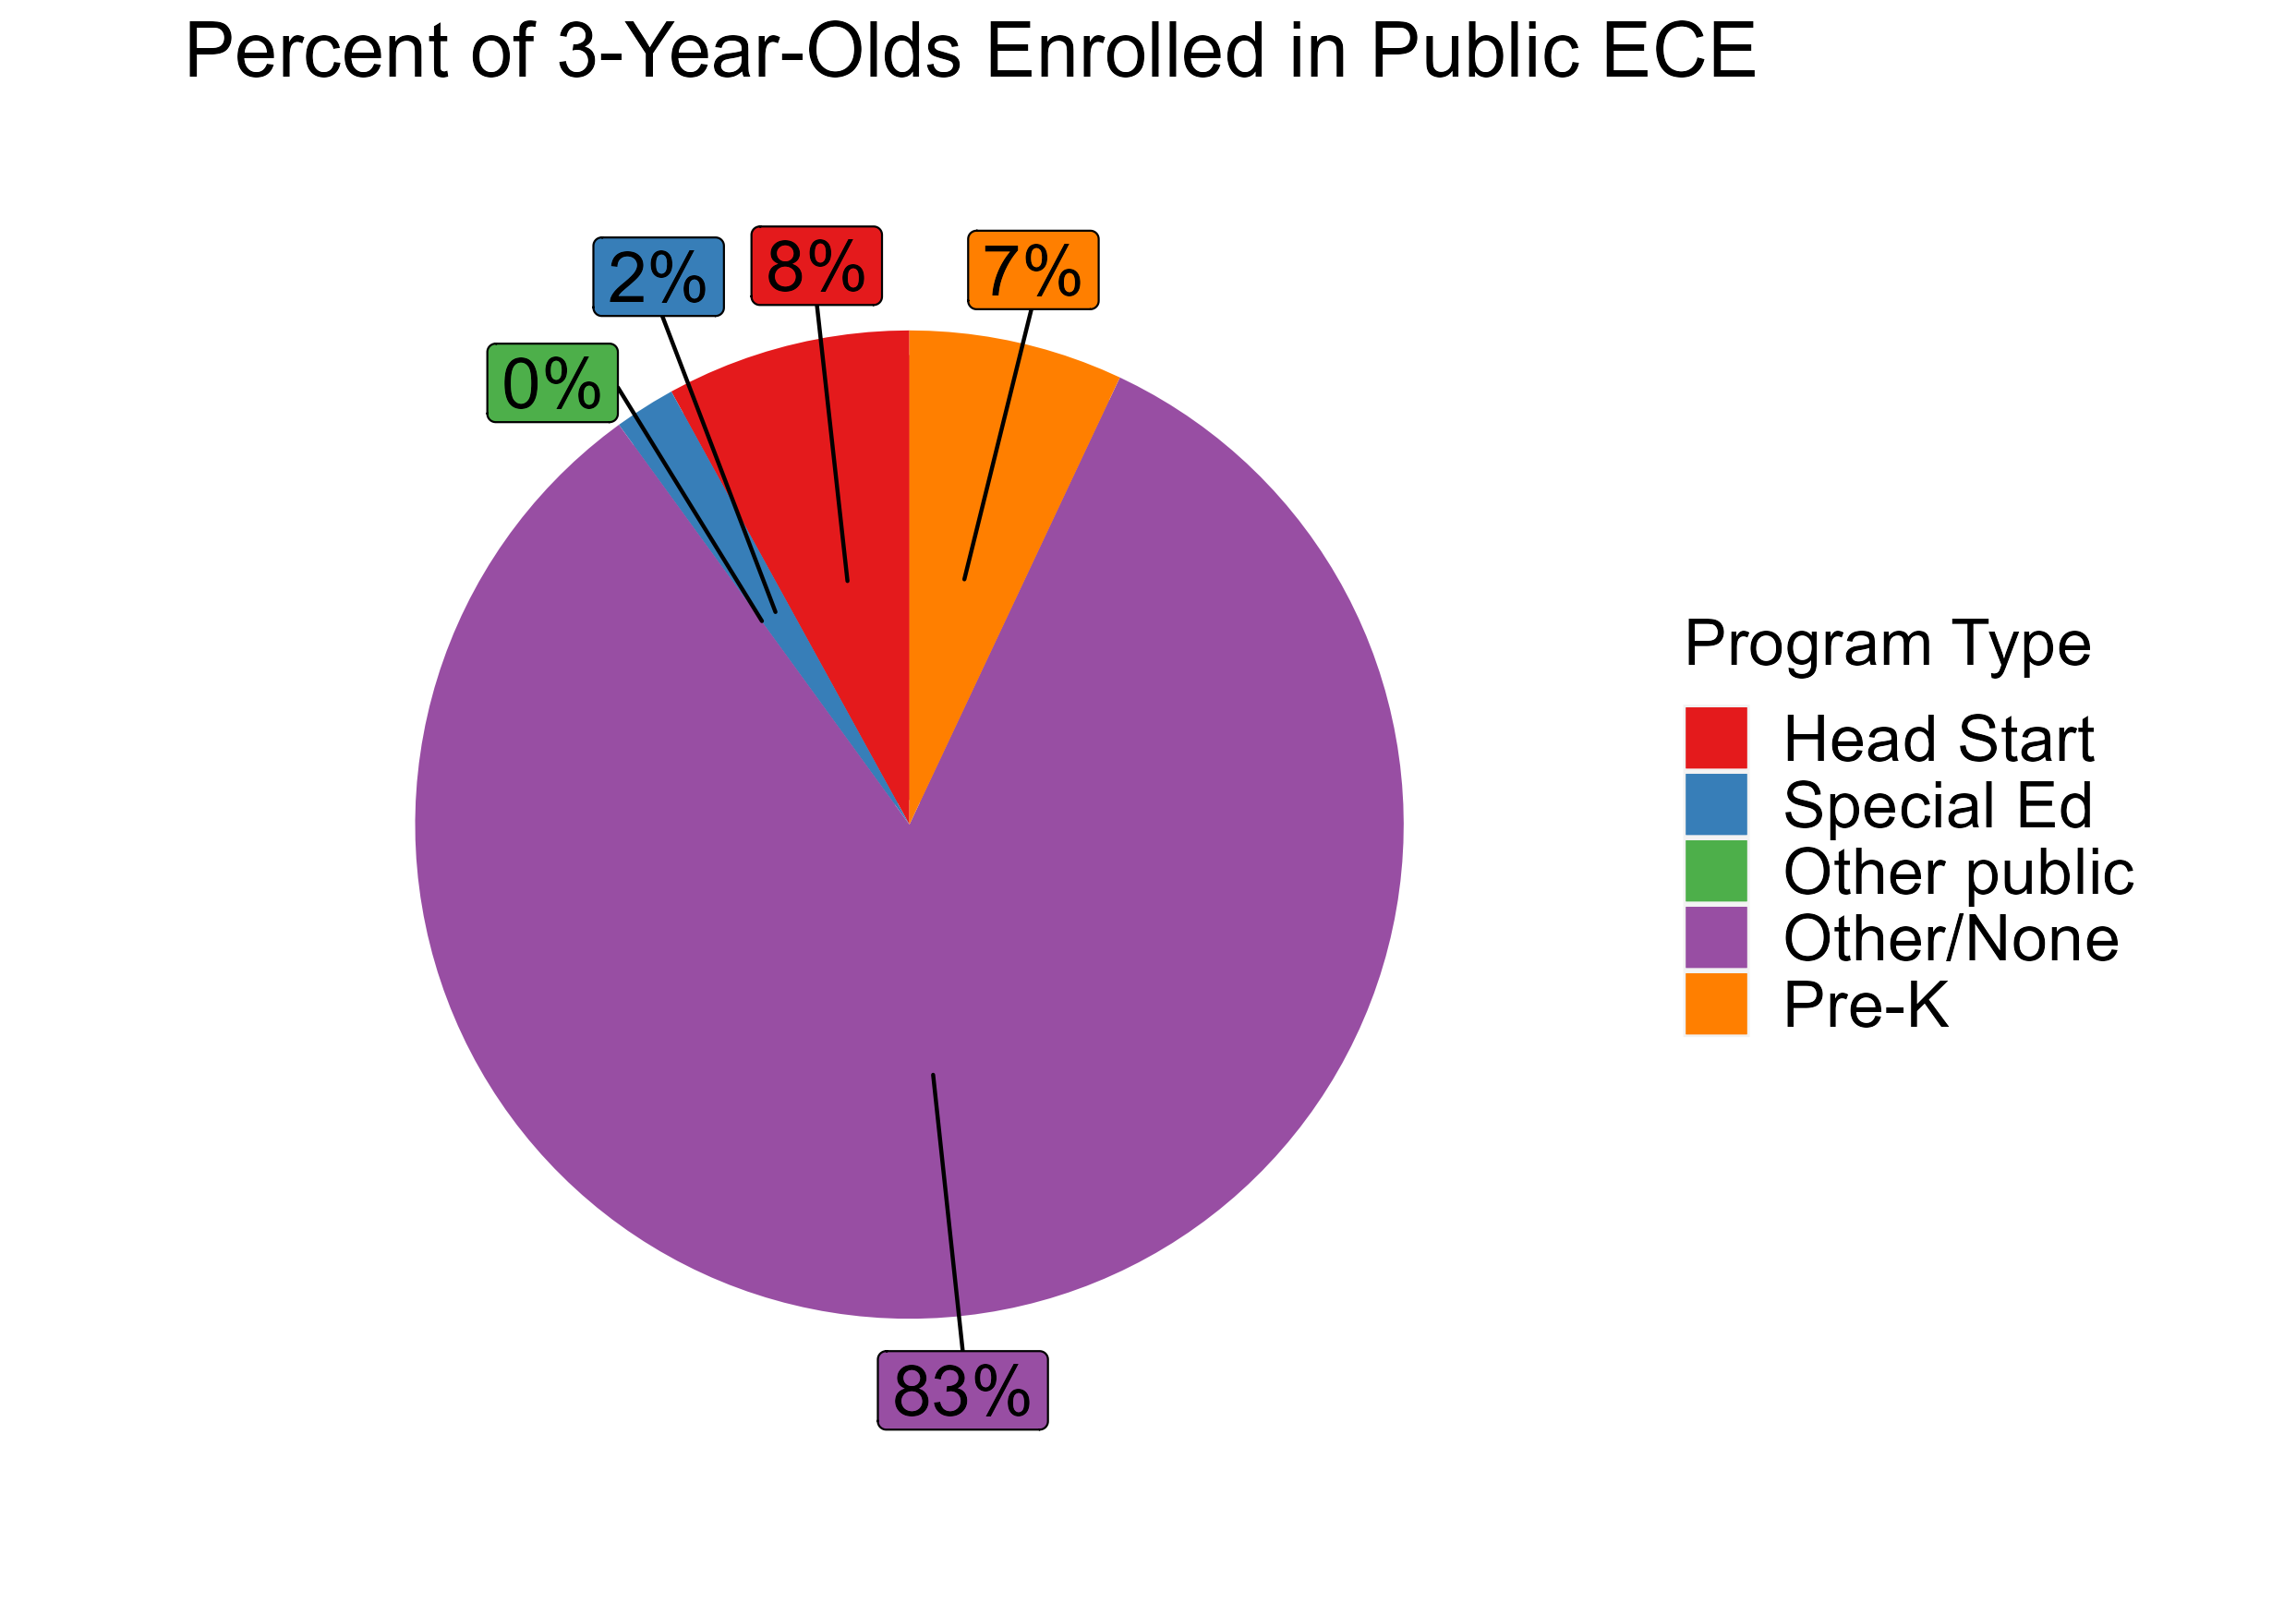
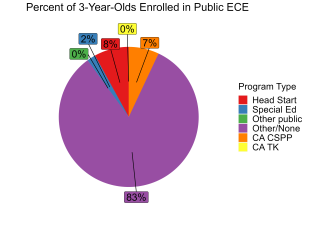
Some Head Start children may also be counted in state pre-K. Estimates children in special education not also enrolled in state pre-K or Head Start. Total state pre-K enrollment 181,614 Special education enrollment, ages 3 and 4 39,993 Federally funded Head Start enrollment, ages 3 and 4 63,995 State-funded Head Start enrollment, ages 3 and 4 0 Resources
Total state pre-K spending $2,220,877,123 State Head Start spending $0 State spending per child enrolled $12,229 All reported spending per child enrolled* $12,238 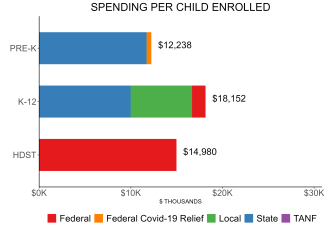
Pre-K programs may receive additional funds from federal or local sources that are not included in this figure. K–12 expenditures include capital spending as well as current operating expenditures. Head Start per-child spending includes funding only for 3- and 4-year-olds.

-
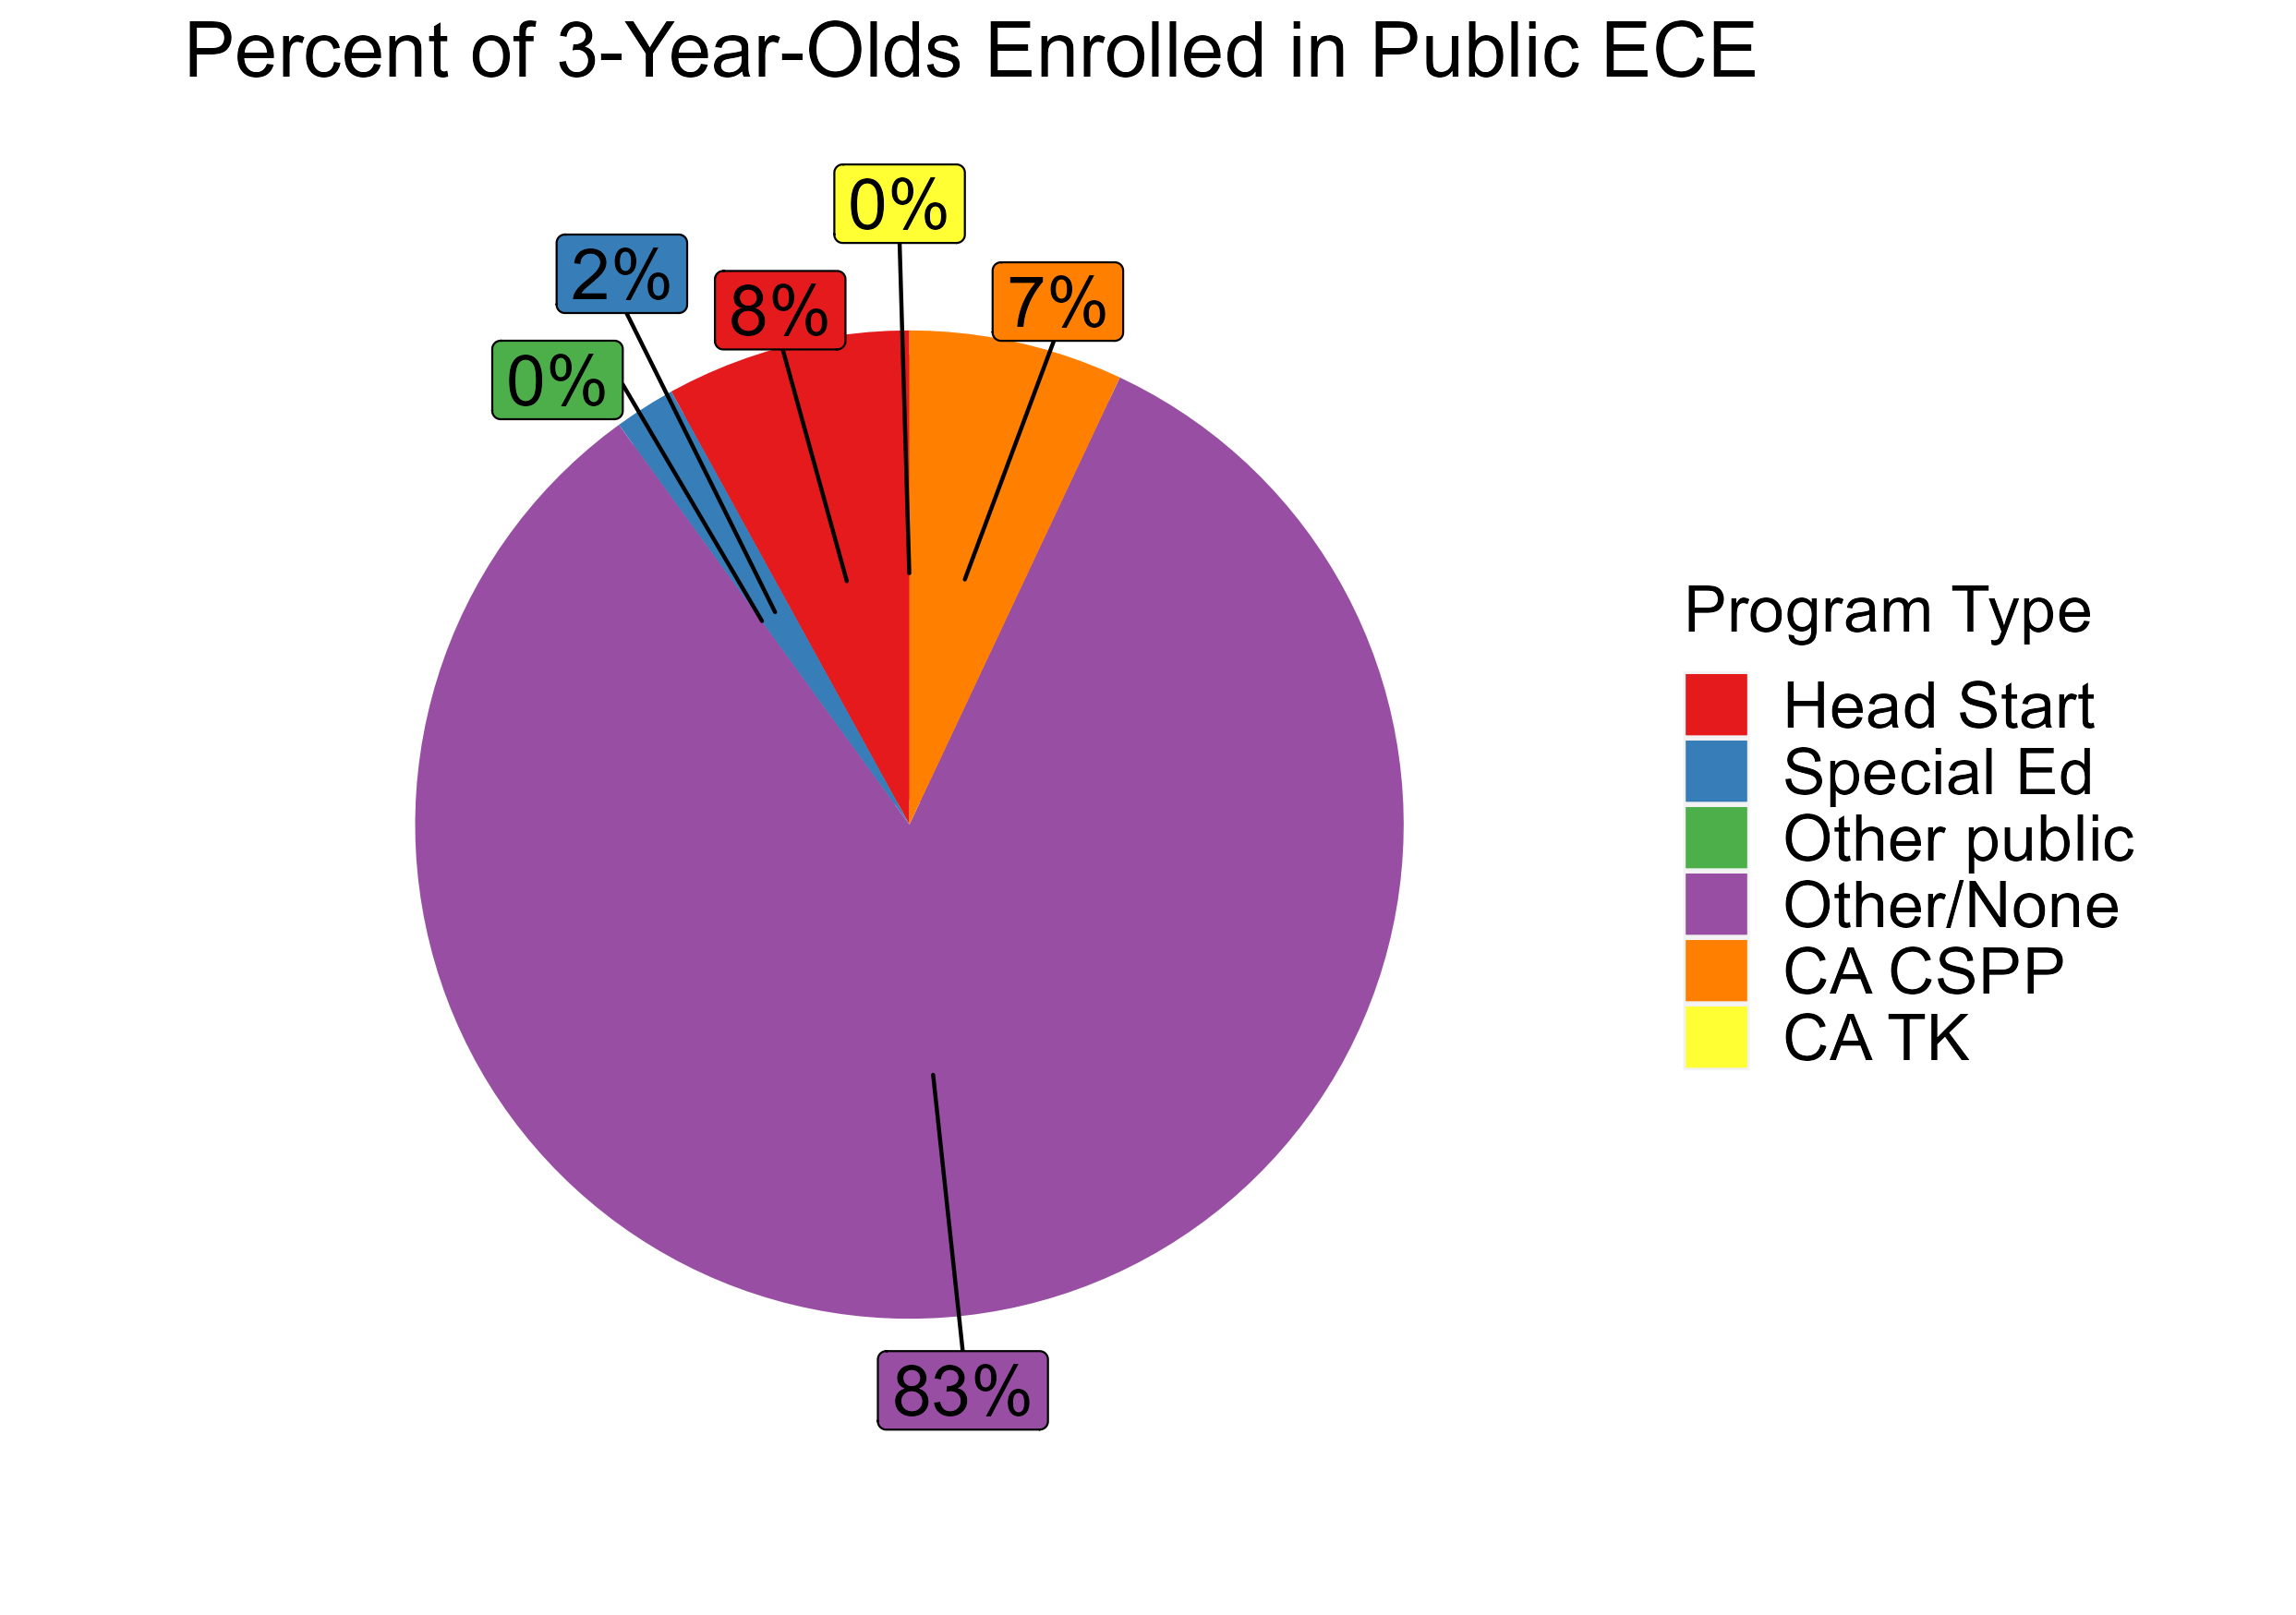
Access


Some Head Start children may also be counted in state pre-K. Estimates children in special education not also enrolled in state pre-K or Head Start. Total state pre-K enrollment 92,445 School districts that offer state program 97% (counties) Income requirement 85% SMI Minimum hours of operation 3 hours/day; 5 days/week Operating schedule Determined locally Resources
Total state pre-K spending $1,255,877,123 Local match required? Yes State spending per child enrolled $13,585 All reported spending per child enrolled* $13,603 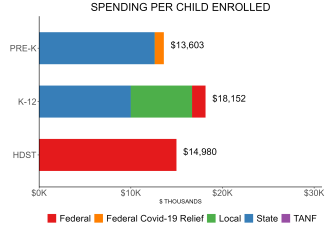
Pre-K programs may receive additional funds from federal or local sources that are not included in this figure. K–12 expenditures include capital spending as well as current operating expenditures. Head Start per-child spending includes funding only for 3- and 4-year-olds.

California State Preschool Program (CSPP) Quality Standards Checklist
| Policy | CA CSPP Requirement | Benchmark | Meets Benchmark? |
|---|---|---|---|
For more information about the benchmarks, see the Executive Summary and the Roadmap to State pages. | 6benchmarks met | ||
| Early Learning & Development Standards Benchmark | Comprehensive, aligned, supported, culturally sensitive | Comprehensive, aligned, supported, culturally sensitive | |
| Curriculum Supports Benchmark | Approval process & supports | Approval process & supports | |
| Teacher Degree Benchmark | California Child Development Associate Teacher Permit | BA | |
| Teacher Specialized Training Benchmark | ECE, CD | Specializing in pre-K | |
| Assistant Teacher Degree Benchmark | HSD | CDA or equivalent | |
| Staff Professional Development Benchmark | 105 hours/5 years; PD plans | For teachers & assistants: At least 15 hours/year; individual PD plans; coaching | |
| Maximum Class Size Benchmark | No limit (3- & 4-year-olds) | 20 or lower | |
| Staff to Child Ratio Benchmark | 1:8 (3- & 4-year-olds) | 1:10 or better | |
| Screening & Referral Benchmark | Vision, hearing, health & more | Vision, hearing & health screenings; & referral | |
| Continuous Quality Improvement System Benchmark | Structured classroom observations; Data used for program improvement | Structured classroom observations; data used for program improvement | |
-
Access

Some Head Start children may also be counted in state pre-K. Estimates children in special education not also enrolled in state pre-K or Head Start. Total state pre-K enrollment 89,169 School districts that offer state program 100% (counties) Income requirement No income requirement Minimum hours of operation 3 hours/day; 5 days/week Operating schedule School or academic year Resources
Total state pre-K spending $965,000,000 Local match required? No State spending per child enrolled $10,822 All reported spending per child enrolled* $10,822 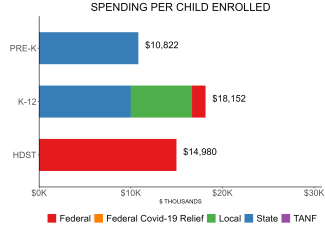
Pre-K programs may receive additional funds from federal or local sources that are not included in this figure. K–12 expenditures include capital spending as well as current operating expenditures. Head Start per-child spending includes funding only for 3- and 4-year-olds.


California Transitional Kindergarten (TK) Quality Standards Checklist
| Policy | CA TK Requirement | Benchmark | Meets Benchmark? |
|---|---|---|---|
For more information about the benchmarks, see the Executive Summary and the Roadmap to State pages. | 3benchmarks met | ||
| Early Learning & Development Standards Benchmark | Comprehensive, aligned, supported, culturally sensitive | Comprehensive, aligned, supported, culturally sensitive | |
| Curriculum Supports Benchmark | Approval process & supports | Approval process & supports | |
| Teacher Degree Benchmark | BA | BA | |
| Teacher Specialized Training Benchmark | ECE, CD, Elem. Ed. | Specializing in pre-K | |
| Assistant Teacher Degree Benchmark | HSD | CDA or equivalent | |
| Staff Professional Development Benchmark | Determined locally | For teachers & assistants: At least 15 hours/year; individual PD plans; coaching | |
| Maximum Class Size Benchmark | 33 (4-year-olds) | 20 or lower | |
| Staff to Child Ratio Benchmark | 1:24 (average, 4-year-olds) | 1:10 or better | |
| Screening & Referral Benchmark | Vision, hearing, health & more; Referrals not required | Vision, hearing & health screenings; & referral | |
| Continuous Quality Improvement System Benchmark | None | Structured classroom observations; data used for program improvement | |