State of Preschool
Arizona
Access Rankings
Resource Rankings
Total Benchmarks Met
Overview

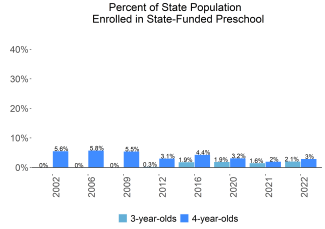
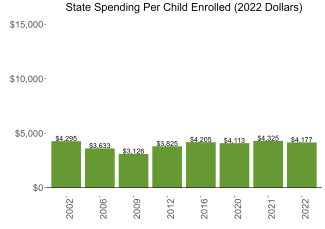
During the 2021-2022 school year, Arizona preschool enrolled 4,810 children, an increase of 1,180 from the prior year, as the program began to recover from the impact of the COVID-19 pandemic. State spending totaled $20,090,440, up $4,390,767 (28%), adjusted for inflation since last year. On a per child basis, state spending equaled $4,177 in 2021-2022, down $148 from 2020-2021, adjusted for inflation. Arizona met 3 of 10 quality standards benchmarks.
What's New
In December 2022, Arizona was awarded a three-year ($42 million) federal Preschool Development Grant Birth through Five (PDG B–5) renewal grant. Funds will be used to increase access to high quality early learning programs (birth to age five), build early childhood educator capacity, support family engagement, and increase inclusive settings for children with disabilities.
Due to the COVID-19 pandemic, structured classroom observations were not required but conducted informally when requested in 2020-2021. In 2021-2022, classroom observation requirements returned to normal. Due to sovereign government executive orders, some programs (less than 10%) were not open in fall 2021.
During 2022-2023, federal COVID-19 relief funds were used to support Quality First (QF) Scholarships by increasing reimbursement rates to the cost of quality as well as increasing the number of scholarships available. Additionally, the City of Phoenix Airport allocated $4 million in federal relief funds to support increased funding and the number of scholarships targeted to airport employees.
Background
Arizona began funding preschool programs in 1991 along with supplemental services for preschool, full-day kindergarten, and first through third grade education supported by the federal Early Childhood Block Grant (ECBG) from 1996 until 2010 when that funding ended.
In 2006, Arizona voters earmarked certain tobacco tax revenues for early childhood development and health programs and created the Early Childhood Development and Health Board, known as First Things First (FTF), to oversee those funds. FTF allocates funds to communities based on the birth to 5 population and percentage of young children in poverty. Volunteer regional councils recommend early childhood strategies to fund, including QF Scholarships serving children birth to age 5 year (before kindergarten) living at or below 200% FPL. Programs are eligible to receive QF Scholarships as long as they participate in QIRS and have met at least a threestar rating on the QIRS quality standards. QF Scholarship reimbursement rates vary by program type.
Dramatic decreases in tobacco tax revenues have resulted in a $48 million drop as of FY22 (29% less than the baseline year of 2008). Despite ongoing decreases in tobacco revenue (3.5% in the past two years alone), FTF’s commitment to QF Scholarships has grown, increasing from $35 million in FY16 to $46.5 million in FY22 in all settings (center-based and home based) and for all ages birth through 5 (before kindergarten). FTF collaborates with the state to meet federal match requirements and preserve about $37 million per year in federal Child Care and Development Fund (CCDF) funds. In the 13 years this partnership has been in place, Arizona has been able to leverage $513.2 million in federal subsidy dollars that otherwise would have been lost.
Quality First Scholarships
Access
Resources
| Total state pre-K spending | $20,090,440 |
| Local match required? | No |
| State Head Start spending | $0 |
| State spending per child enrolled | $4,177 |
| All reported spending per child enrolled* | $4,177 |
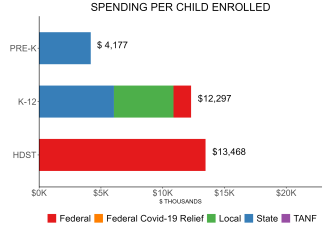
Pre-K programs may receive additional funds from federal or local sources that are not included in this figure. K–12 expenditures include capital spending as well as current operating expenditures. Head Start per-child spending includes funding only for 3- and 4-year-olds.
Arizona Quality Standards Checklist
| Policy | Requirement | Benchmark | Meets Benchmark? |
|---|---|---|---|
For more information about the benchmarks, see the Executive Summary and the Roadmap to State pages. | 3benchmarks met | ||
| Early Learning & Development Standards Benchmark | Comprehensive, aligned, supported, culturally sensitive | Comprehensive, aligned, supported, culturally sensitive | |
| Curriculum Supports Benchmark | Approval process & supports | Approval process & supports | |
| Teacher Degree Benchmark | HSD | BA | |
| Teacher Specialized Training Benchmark | None | Specializing in pre-K | |
| Assistant Teacher Degree Benchmark | None | CDA or equivalent | |
| Staff Professional Development Benchmark | 18 hours/year | For teachers & assistants: At least 15 hours/year; individual PD plans; coaching | |
| Maximum Class Size Benchmark | 26 (3-year-olds); 30 (4-year-olds) | 20 or lower | |
| Staff to Child Ratio Benchmark | 1:13 (3-year-olds); 1:15 (4-year-olds) | 1:10 or better | |
| Screening & Referral Benchmark | Immunizations | Vision, hearing & health screenings; & referral | |
| Continuous Quality Improvement System Benchmark | Structured classroom observations; Data used for program improvement | Structured classroom observations; data used for program improvement | |
