State of Preschool
Virginia
Access Rankings
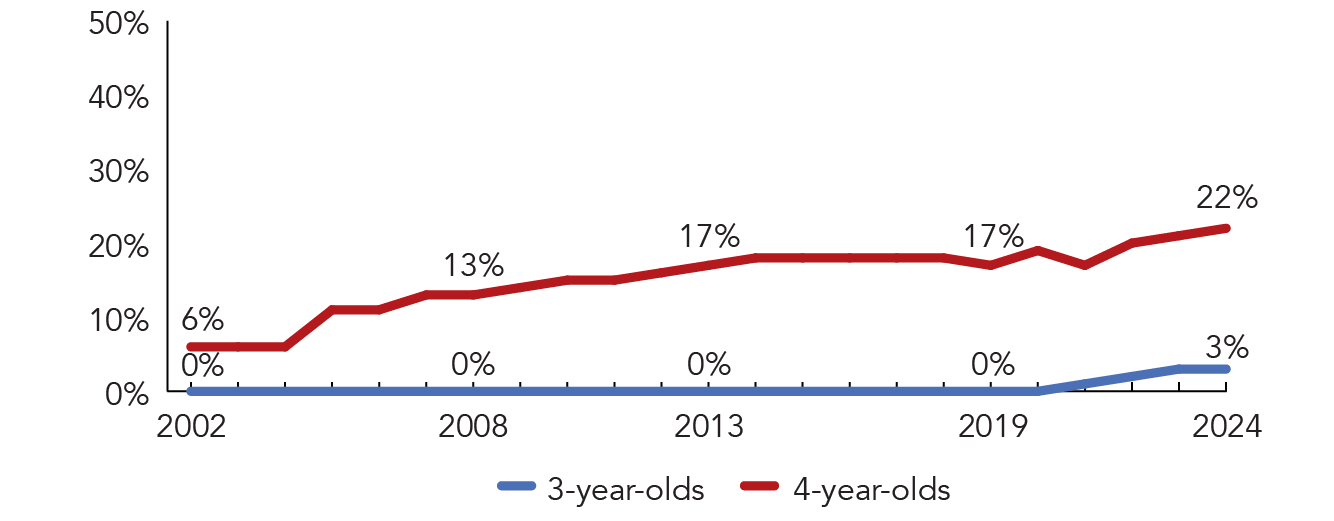
4-year-Olds
30
3-year-Olds
26
Resource Rankings
State spending
27
All reported spending
20
Total Benchmarks Met
Of 10 benchmarks possible
4.9
Overview
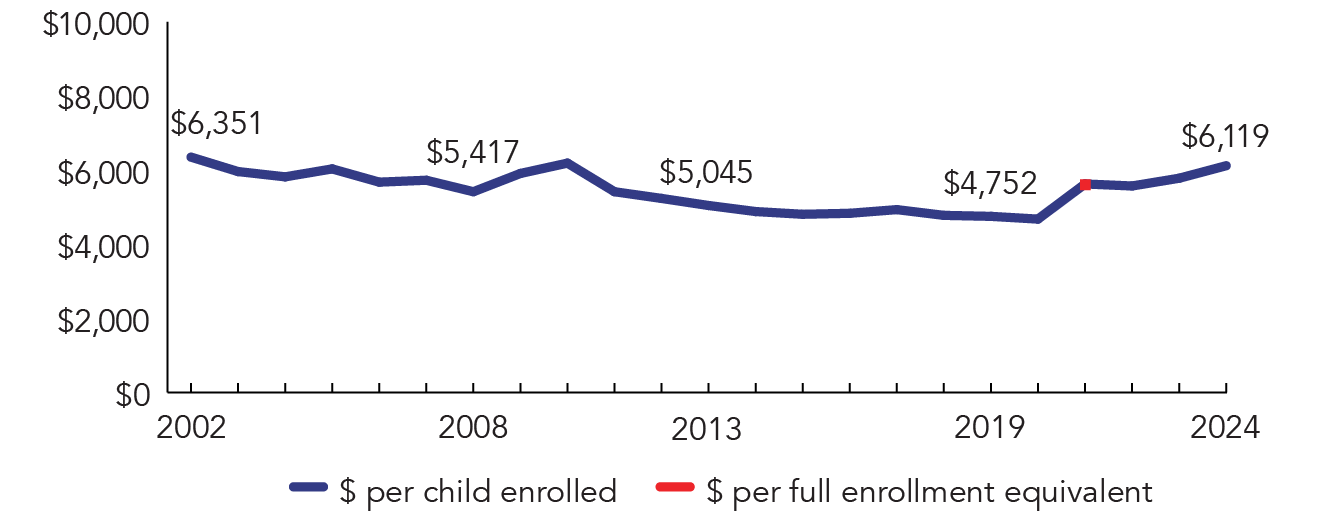
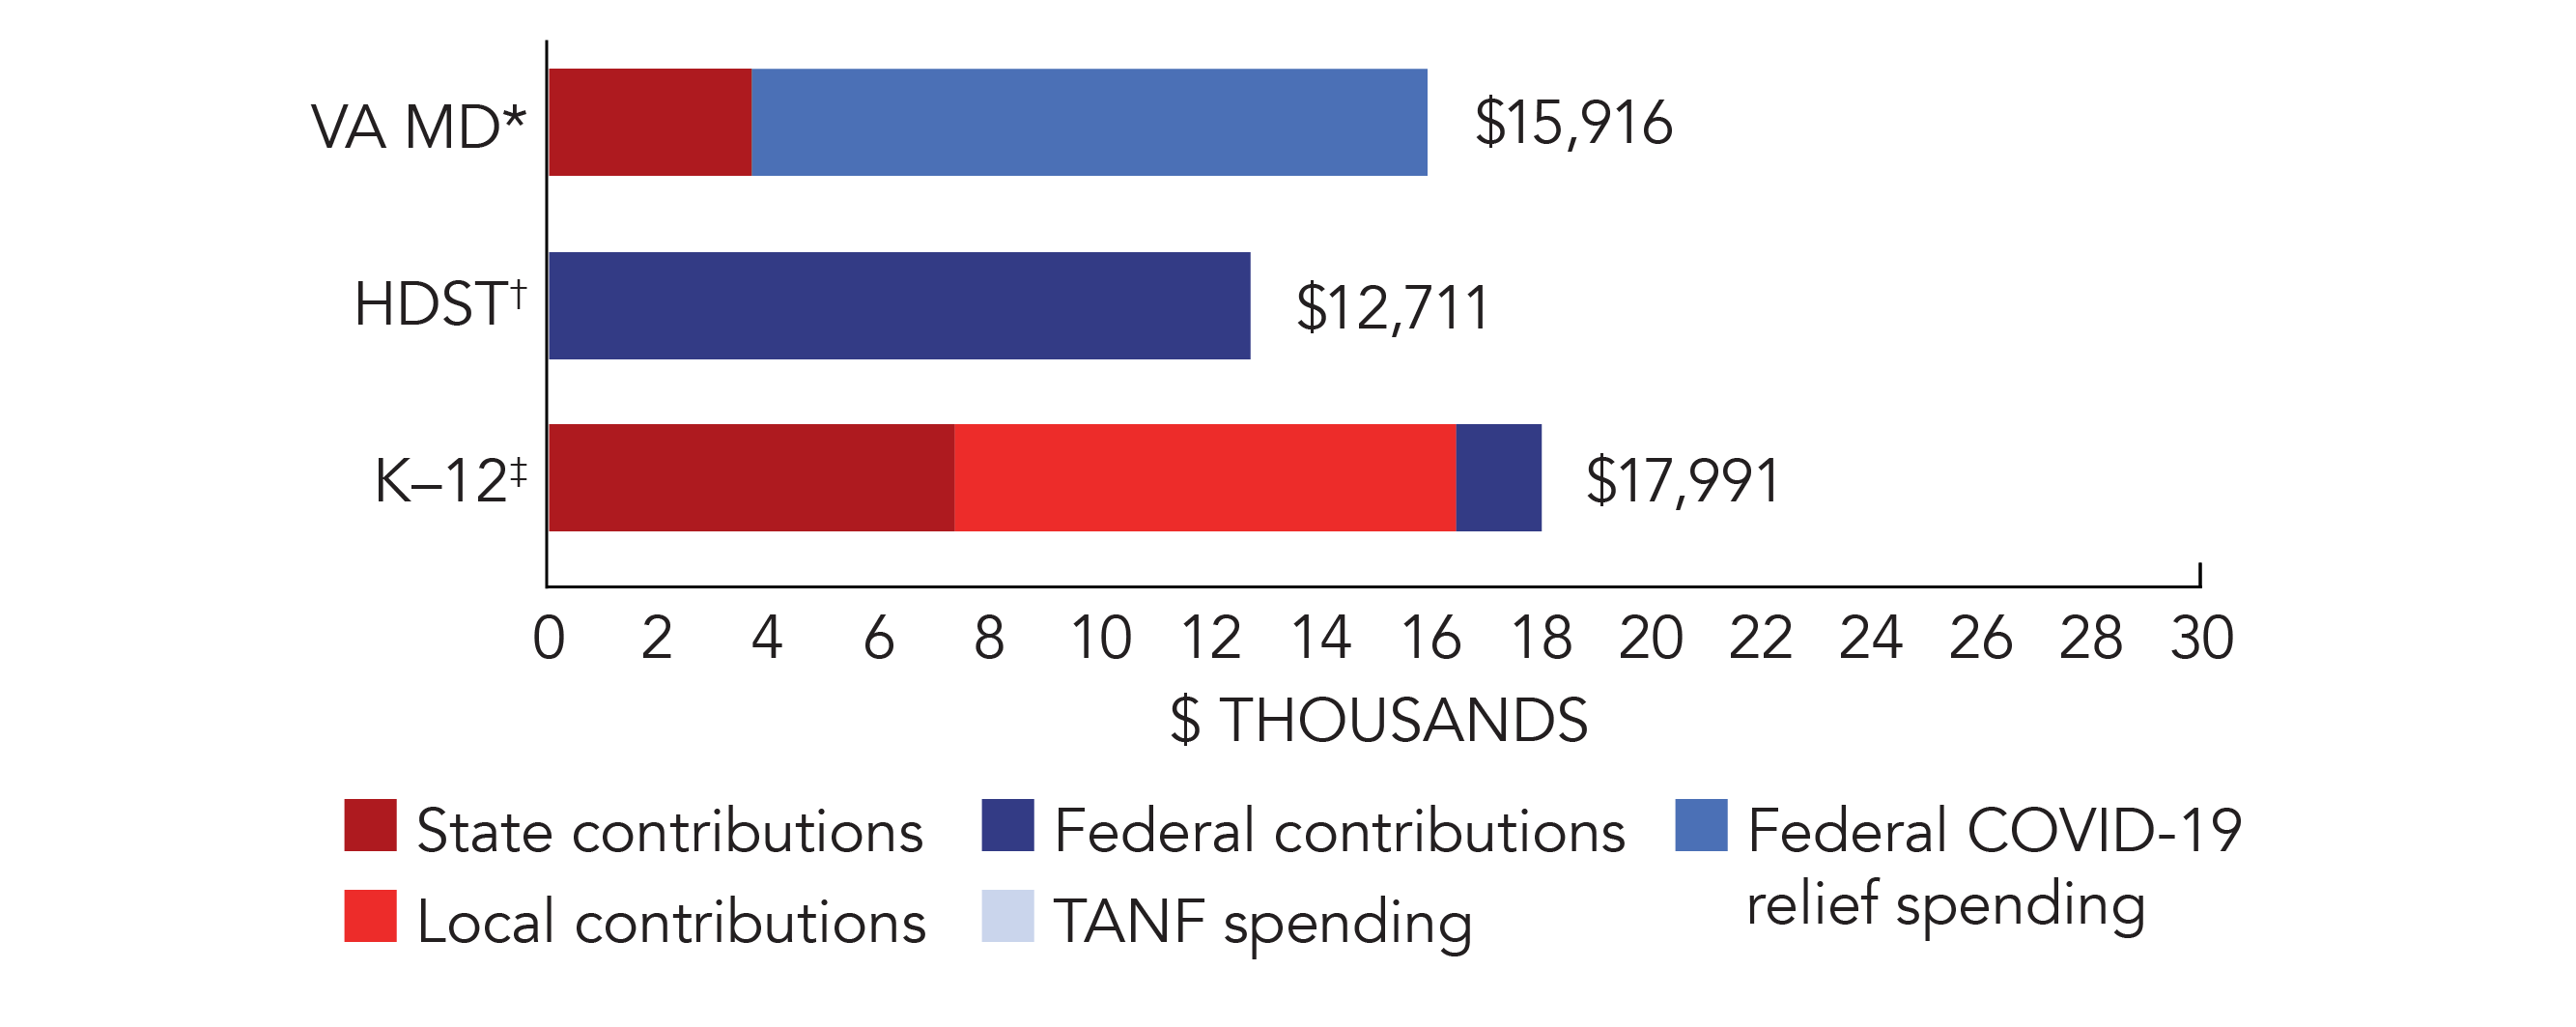
During the 2023-2024 school year, Virginia’s two preschool programs enrolled a total of 24,993 preschool-age children, an increase of 824 from the prior year. State spending for both programs totaled $128,998,178, and an additional $23,945,122 in federal recovery funds supported Mixed Delivery, up $13,223,463 (9%) total, adjusted for inflation, since last year. State spending per child (including federal recovery funds) for both programs equaled $6,119 in 2023-2024, up $338 from 2022-2023, adjusted for inflation. State spending per child for the Virgina Preschool Initiative (VPI) equaled $5,288. State spending per child for Mixed Delivery preschool equaled $15,916 (including recovery funds). The average Mixed Delivery slot reimbursement rate for preschool slots as of September 30, 2023, was $14,052. This is less than the total dollar amount divided by the number of children served because of regional coordination costs and typical enrollment fluctuations. VPI met 5 of 10 quality standards benchmarks, while Mixed Delivery met 4 of 10.
What's New
In 2023-2024, all publicly-funded early childhood programs were required to participate in VQB5, Virginia’s quality measurement and improvement system for the first time. VQB5 uses measures of teacher-child interactions and curriculum to support improvement. The first public quality ratings were shared in October 2024 on the new VQB5 Quality Profile website.
VPI: 2023-24 was also the first year that VPI teachers in non-public community provider settings were exempt from teacher licensing requirements. This meant that teachers in a community provider setting could be paid with VPI funds regardless of licensure status. This change meant that VPI did not meet NIEER’s Teacher specialized training benchmark for the 2023-24 school year. In 2024, the VPI per pupil rate was rebenchmarked to reflect current costs of care and quality in school settings, increasing rates by 19% for most localities in the 2024-2025 school year.
Mixed Delivery: Beginning with the 2023-24 program year, Virginia increased rates for its Mixed Delivery preschool program to 100% of the Cost of Quality for child care settings. While increases in teacher compensation are not required in Mixed Delivery, the increase in the funding formula encourages site leaders to invest in classroom and center stability by increasing compensation for teachers that approach public school teachers’ salary and benefits. Most of the Mixed Delivery funding came from federal relief funds in 2022-23 and 2023-24. The program received additional state funding in the 2025-26 biennial budget to sustain program enrollment.
Additionally, in September 2024, Virginia was one of ten states and D.C. awarded a 3-year federal renewal Preschool Development Grant B-5 (PDG B-5) totaling $8 million annually. The PDG B-5 renewal grant is intended to carry out the strategic plans developed with the 2023 planning grant. With current PDG funding, Virginia will integrate technology platforms and data systems and scale coordinated enrollment platforms across the state; build capacity of Virginia’s nine Ready Regions to use data effectively to support increased access to services; and support increases in quality classroom and workforce supports.
Background
The Virginia Preschool Initiative (VPI) began in 1995 to serve at-risk 4-year-olds not enrolled in existing preschool programs. During the 2023-24 school year, VPI programs operated in 96% of eligible school divisions. Programs are required to operate for a minimum of three hours per day, though 95% of children attend full-day programs throughout the school year. VPI is funded by an annual legislative appropriation of state general funds and a required local match based on the local composite index. The local match is capped at half the per-pupil amount. Funding for VPI is available to school divisions where there are at-risk 3- and 4-year-olds not served by Head Start.
The Mixed Delivery program began during the 2016-2017 school year and was included in the State of Preschool Yearbook for the first time in 2022. This program is administered by the Virginia Early Childhood Foundation (VECF) as a public/private partnership and provides publicly funded early childhood care and education (ECCE) services in licensed, non-school-based and non-faith-based private ECCE settings. Eligible children are those who have been identified as at-risk for entering kindergarten without the necessary social and academic skills for success. In 2023-24, the Mixed Delivery program was able to increase funding to fully cover the estimated cost of quality for full-day, year-round services.
-
Access
Total state pre-K enrollment 24,993 Special education enrollment, ages 3 and 4 11,713 Federally funded Head Start enrollment, ages 3 and 4 9,227 State-funded Head Start enrollment, ages 3 and 4 0 Resources
Total state pre-K spending $152,943,300 State Head Start spending $0 State spending per child enrolled $6,119 All reported spending per child enrolled* $9,751 
*Pre-K programs may receive additional funds from federal or local sources that are not included in this figure. †Head Start per-child spending includes funding only for 3- and 4-year-olds. ‡K–12 expenditures include capital spending as well as current operating expenditures.


-
Access
Total state pre-K enrollment 23,038 School districts that offer state program 96% (school divisions) Income requirement 200% FPL Minimum hours of operation 3 hours/day; 5 days/week Operating schedule School or academic year Resources
Total state pre-K spending $121,827,978 Local match required? Yes State spending per child enrolled $5,288 All reported spending per child enrolled* $9,228 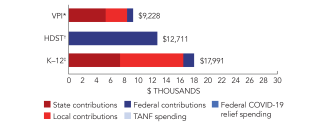
*Pre-K programs may receive additional funds from federal or local sources that are not included in this figure. †Head Start per-child spending includes funding only for 3- and 4-year-olds. ‡K–12 expenditures include capital spending as well as current operating expenditures.


Virginia Preschool Initiative Quality Standards Checklist
| Policy | VA VPI Requirement | Benchmark | Meets Benchmark? |
|---|---|---|---|
For more information about the benchmarks, see the Executive Summary and the Roadmap to State pages. | 5benchmarks met | ||
| Early Learning & Development Standards Benchmark | Comprehensive, aligned, supported, culturally sensitive | Comprehensive, aligned, supported, culturally sensitive | |
| Curriculum Supports Benchmark | Approval process & supports | Approval process & supports | |
| Teacher Degree Benchmark | BA (public); HSD (nonpublic) | BA | |
| Teacher Specialized Training Benchmark | ECE, CD, ECE SpEd (public); None (nonpublic) | Specializing in pre-K | |
| Assistant Teacher Degree Benchmark | HSD (public); None (nonpublic) | CDA or equivalent | |
| Staff Professional Development Benchmark | 15 hours/school year | For teachers & assistants: At least 15 hours/year; individual PD plans; coaching | |
| Maximum Class Size Benchmark | 20 (3- & 4-year-olds) | 20 or lower | |
| Staff to Child Ratio Benchmark | 1:10 (3- & 4-year-olds) | 1:10 or better | |
| Screening & Referral Benchmark | Vision, hearing, health & more; Referrals not required | Vision, hearing & health screenings; & referral | |
| Continuous Quality Improvement System Benchmark | Structured classroom observations; Data used for program improvement | Structured classroom observations; data used for program improvement | |
-
Access
Total state pre-K enrollment 1,955 School districts that offer state program 51% (localities) Income requirement 200% FPL Minimum hours of operation 10 hours/day; 5 days/week Operating schedule Full calendar year Resources
Total state pre-K spending $31,115,322 Local match required? No State spending per child enrolled $15,916 All reported spending per child enrolled* $15,916 
*Pre-K programs may receive additional funds from federal or local sources that are not included in this figure. †Head Start per-child spending includes funding only for 3- and 4-year-olds. ‡K–12 expenditures include capital spending as well as current operating expenditures.
Virginia Early Childhood Foundation Mixed Delivery Quality Standards Checklist
| Policy | VA Mixed Delivery Requirement | Benchmark | Meets Benchmark? |
|---|---|---|---|
For more information about the benchmarks, see the Executive Summary and the Roadmap to State pages. | 4benchmarks met | ||
| Early Learning & Development Standards Benchmark | Comprehensive, aligned, supported, culturally sensitive | Comprehensive, aligned, supported, culturally sensitive | |
| Curriculum Supports Benchmark | Approval process & supports | Approval process & supports | |
| Teacher Degree Benchmark | None | BA | |
| Teacher Specialized Training Benchmark | None | Specializing in pre-K | |
| Assistant Teacher Degree Benchmark | None | CDA or equivalent | |
| Staff Professional Development Benchmark | 16 hours/school year | For teachers & assistants: At least 15 hours/year; individual PD plans; coaching | |
| Maximum Class Size Benchmark | 30 (3- & 4-year-olds) | 20 or lower | |
| Staff to Child Ratio Benchmark | 1:10 (3- & 4-year-olds) | 1:10 or better | |
| Screening & Referral Benchmark | Immunizations; Referrals not required | Vision, hearing & health screenings; & referral | |
| Continuous Quality Improvement System Benchmark | Structured classroom observations; Data used for program improvement | Structured classroom observations; data used for program improvement | |