State of Preschool
Nevada
Access Rankings
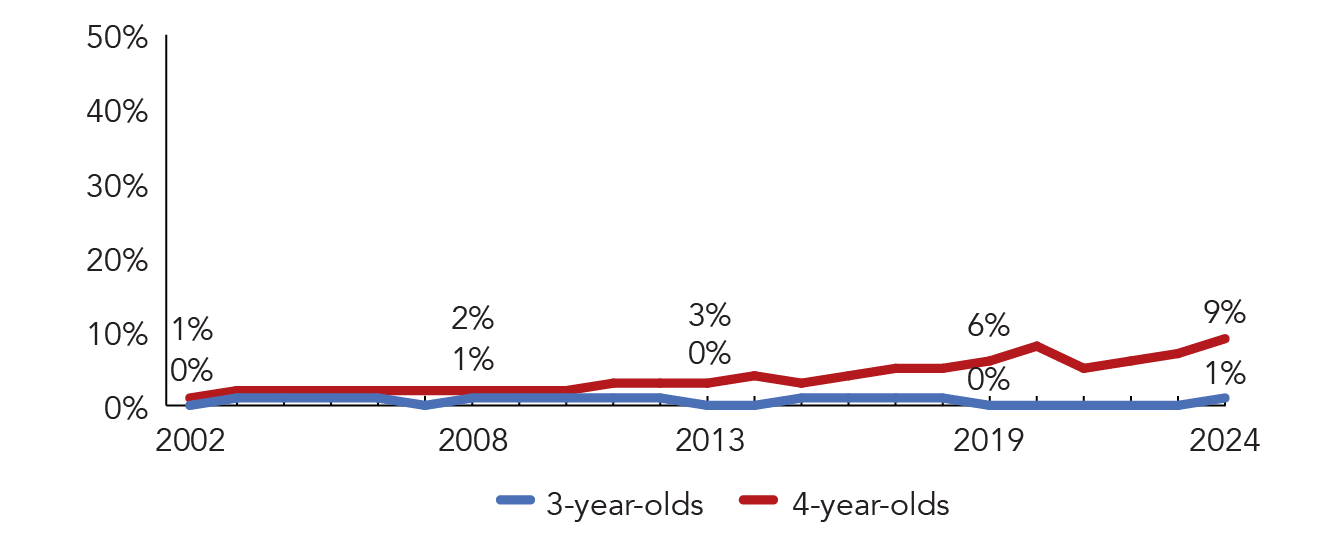
4-year-Olds
41
3-year-Olds
31
Resource Rankings
State spending
10
All reported spending
21
Total Benchmarks Met
Of 10 benchmarks possible
7
Overview
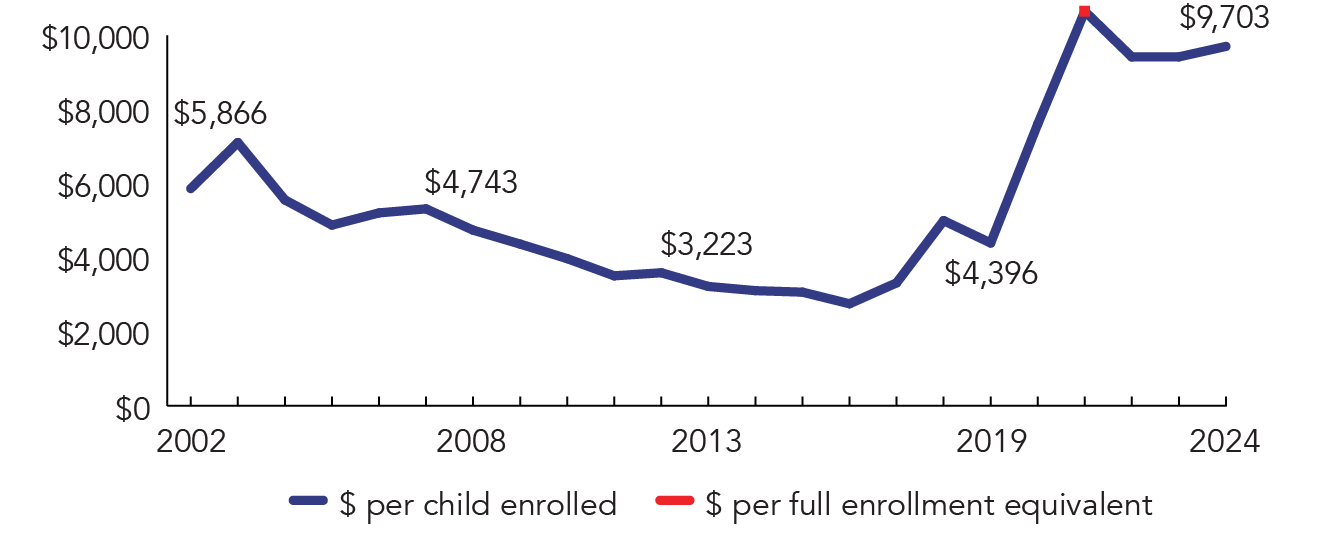
During the 2023-2024 school year, Nevada preschool enrolled 3,606 children, an increase of 1,125 from the prior year. State spending totaled $31,825,701, and an additional $3,162,160 in federal recovery funds supported the program, up $11,615,598 (50%), adjusted for inflation, since last year. State spending per child (including federal recovery funds) equaled $9,703 in 2023-2024, up $282 from 2022-2023, adjusted for inflation. Nevada met 7 of 10 quality standards benchmarks.
What's New
The 2023 Legislative session passed the Early Childhood Innovation Literacy Program (ECILP) to expand and enhance a literacy program for children under the age of six. The $70 million allocated funds were used to increase access to State Pre-K through expanding income eligibility and including 3-year-olds, early literacy related innovations and interventions, and funding for infrastructure needs related to serving students under 6-years-old.
In December 2022, Nevada was awarded a federal Preschool Development Grant Birth through Five (PDG B–5) renewal grant for $10 million. Funds are being used for a variety of activities including funding a pilot program which will allow family child care homes to participate in state-funded preschool.
Background
The Nevada Ready! State Pre-K (NR!PK) (formerly known as the Nevada State Pre-Kindergarten Program) began in 2001. Programs operate in both community-based organizations and school districts. During the 2023-2024 school year, NR!PK operated in 10 LEAs and 4 CBOs, and the state funded grant (ECILP) added two additional LEAs. In total, 13 of 17 counties offer State Pre-K. The Office of Early Learning and Development (OELD) within the Nevada Department of Education (NDE) is responsible for administering multiple early childhood state and federal funding sources including State Pre-K. Beginning in 2019- 2020, pre-K funds were no longer awarded through competitive grants but were instead distributed to existing school districts or programs based on the previous year’s final expenditures.
Districts and programs determine eligibility based on highest need, which can include children from low-income families, those who are homeless, English Language Learners, or children receiving special education services. NR!PK eligibility is set at 200% of FPL based on previous Preschool Development Grant (PDG) requirements. Programs can serve other children that do not meet the income requirement if there are no income eligible children on the waiting list and/or if they are braiding funds.
Nevada Ready! State Pre-K
Access
| |
| Total state pre-K enrollment | 3,606 |
| School districts that offer state program | 71% (LEAs) & 4 community-based organizations |
| Income requirement | 200% FPL (NR!PK); 250% FPL (ECILP) |
| Minimum hours of operation | 5 hours/day or 25 hours/week |
| Operating schedule | Determined locally |
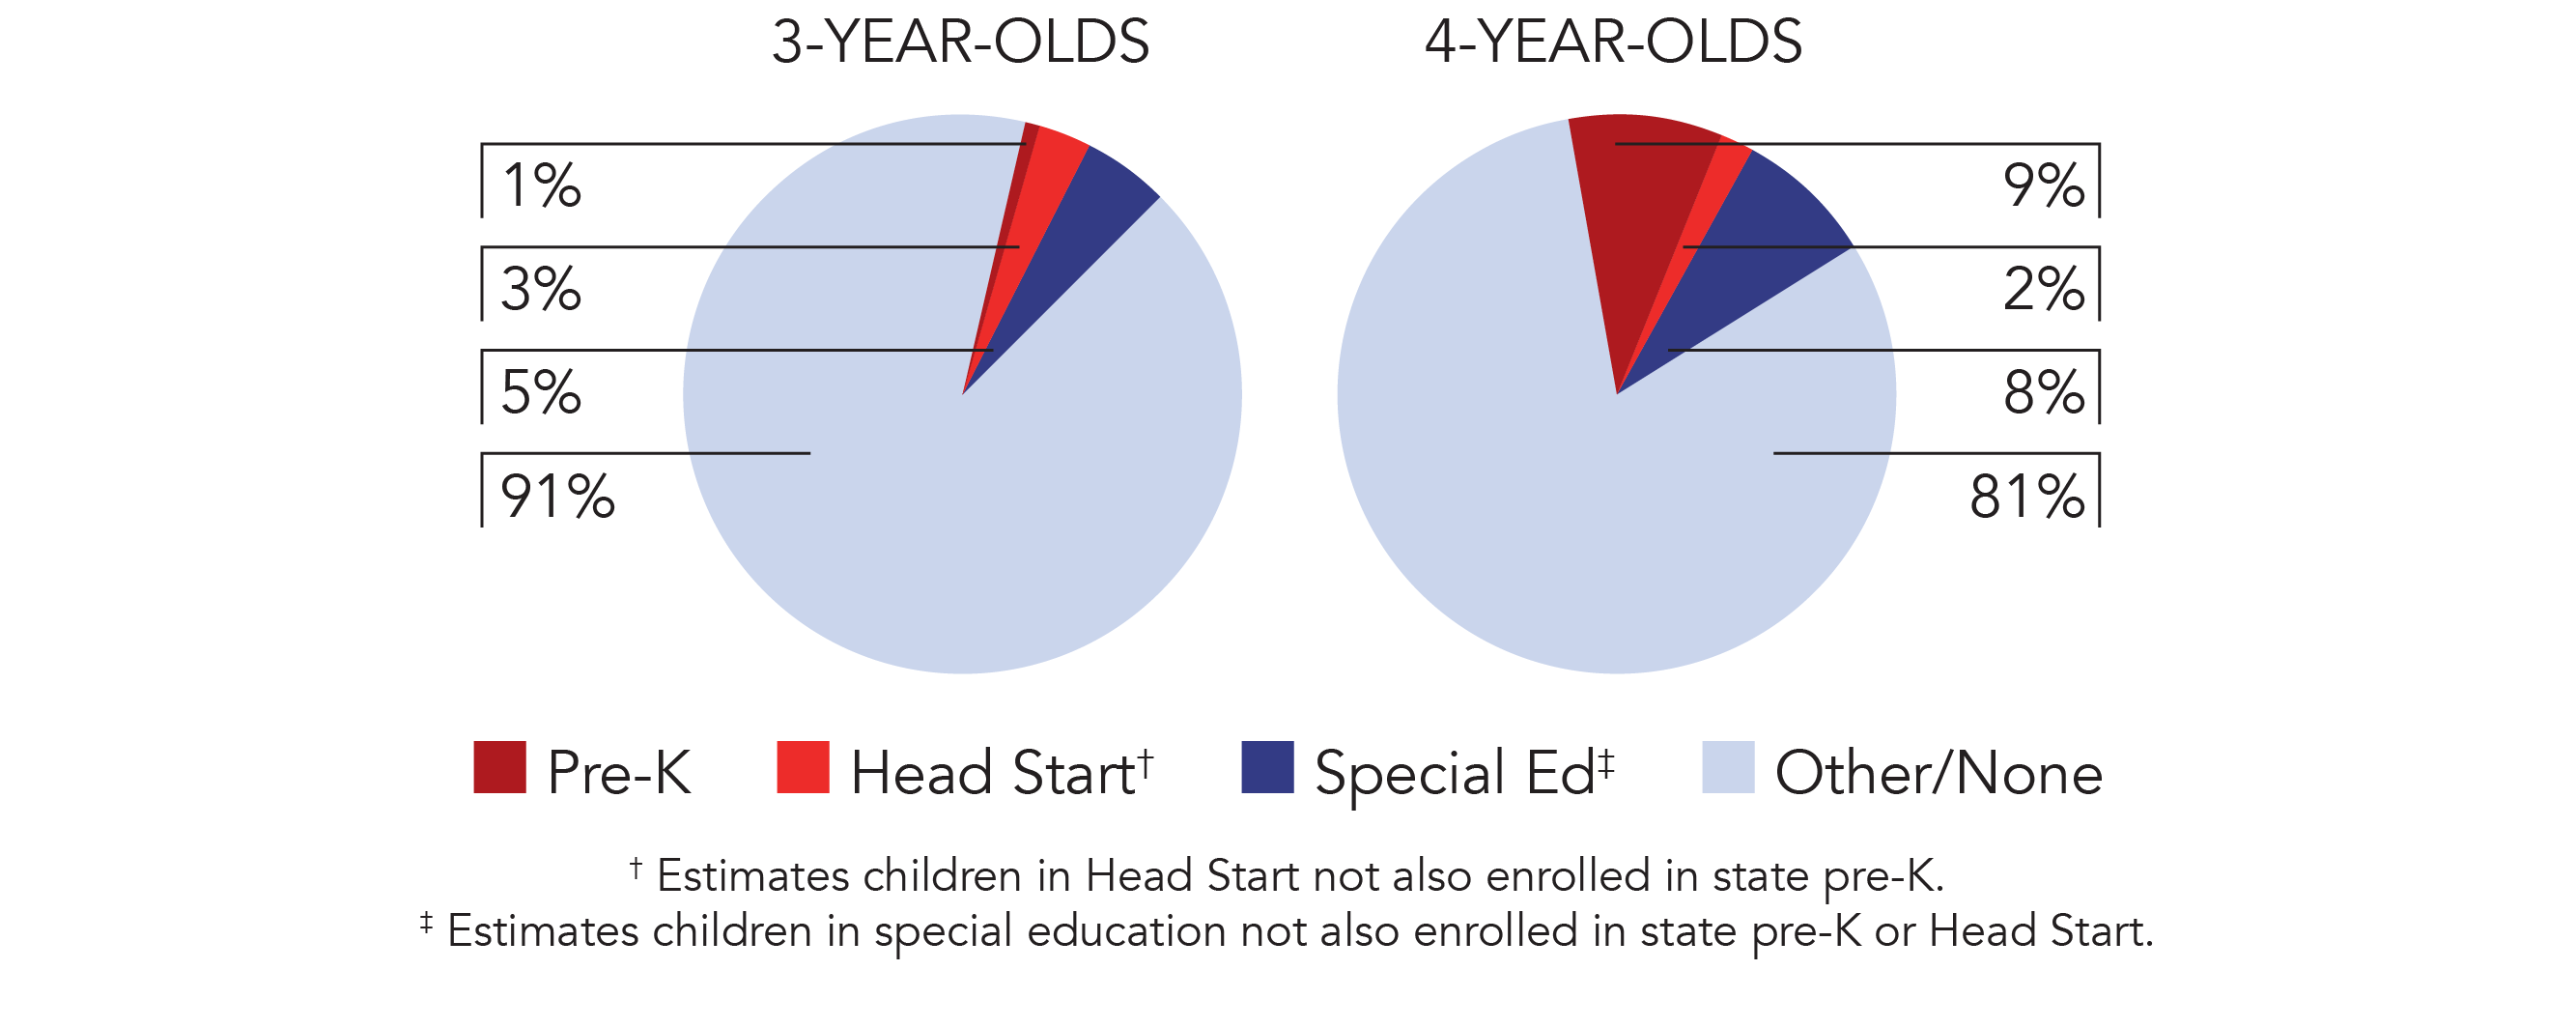
| Special education enrollment, ages 3 and 4 | 4,899 |
| Federally funded Head Start enrollment, ages 3 and 4 | 2,068 |
| State-funded Head Start enrollment, ages 3 and 4 | 0 |
Resources
| Total state pre-K spending | $34,987,861 |
| Local match required? | No |
| State Head Start spending | $0 |
| State spending per child enrolled | $9,703 |
| All reported spending per child enrolled* | $9,703 |
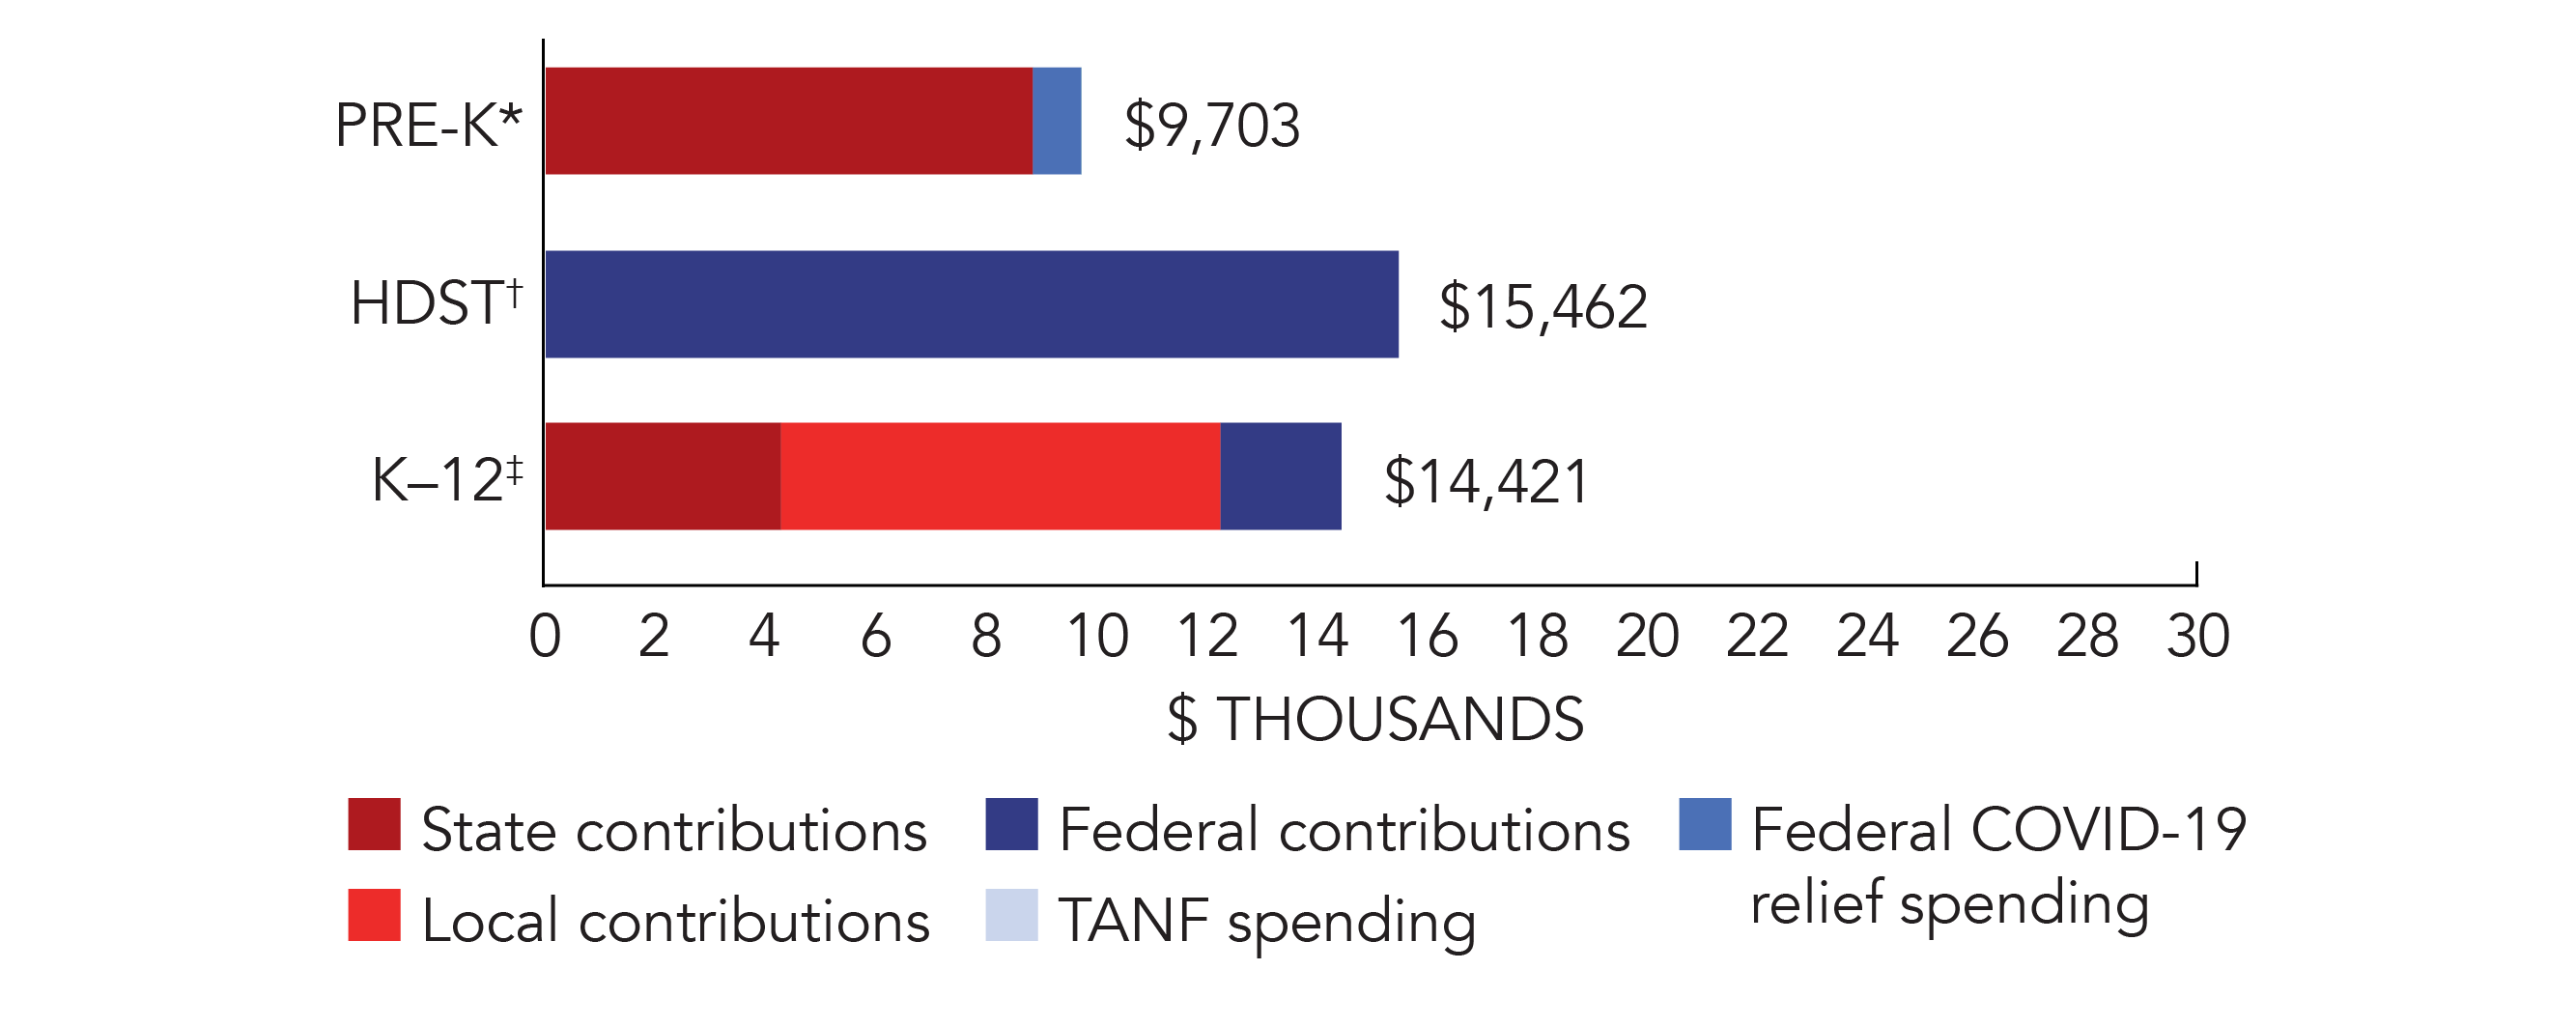
*Pre-K programs may receive additional funds from federal or local sources that are not included in this figure. †Head Start per-child spending includes funding only for 3- and 4-year-olds. ‡K–12 expenditures include capital spending as well as current operating expenditures.
Nevada Quality Standards Checklist
| Policy | Requirement | Benchmark | Meets Benchmark? |
|---|---|---|---|
For more information about the benchmarks, see the Executive Summary and the Roadmap to State pages. | 7benchmarks met | ||
| Early Learning & Development Standards Benchmark | Comprehensive, aligned, supported, culturally sensitive | Comprehensive, aligned, supported, culturally sensitive | |
| Curriculum Supports Benchmark | Approval process & supports | Approval process & supports | |
| Teacher Degree Benchmark | BA (public); BA (waiver if enrolled in TEACH, nonpublic) | BA | |
| Teacher Specialized Training Benchmark | ECE | Specializing in pre-K | |
| Assistant Teacher Degree Benchmark | HSD | CDA or equivalent | |
| Staff Professional Development Benchmark | 6 credit hours/5 years (public); 24 hours/year (nonpublic) | For teachers & assistants: At least 15 hours/year; individual PD plans; coaching | |
| Maximum Class Size Benchmark | 20 (3- & 4-year-olds) | 20 or lower | |
| Staff to Child Ratio Benchmark | 1:10 (3- & 4-year-olds) | 1:10 or better | |
| Screening & Referral Benchmark | Vision, hearing, health & more | Vision, hearing & health screenings; & referral | |
| Continuous Quality Improvement System Benchmark | Structured classroom observations; Data used for program improvement | Structured classroom observations; data used for program improvement | |