State of Preschool
Missouri
Access Rankings
4-year-Olds
39
3-year-Olds
29
Resource Rankings
State spending
34
All reported spending
39
Total Benchmarks Met
Of 10 benchmarks possible
4.3
Overview
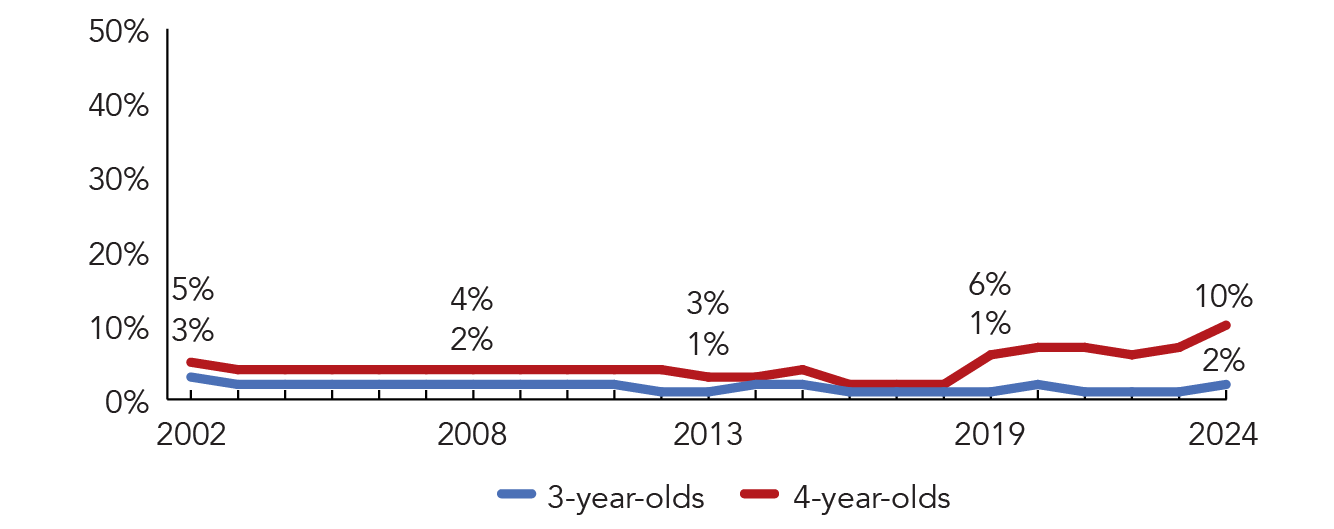
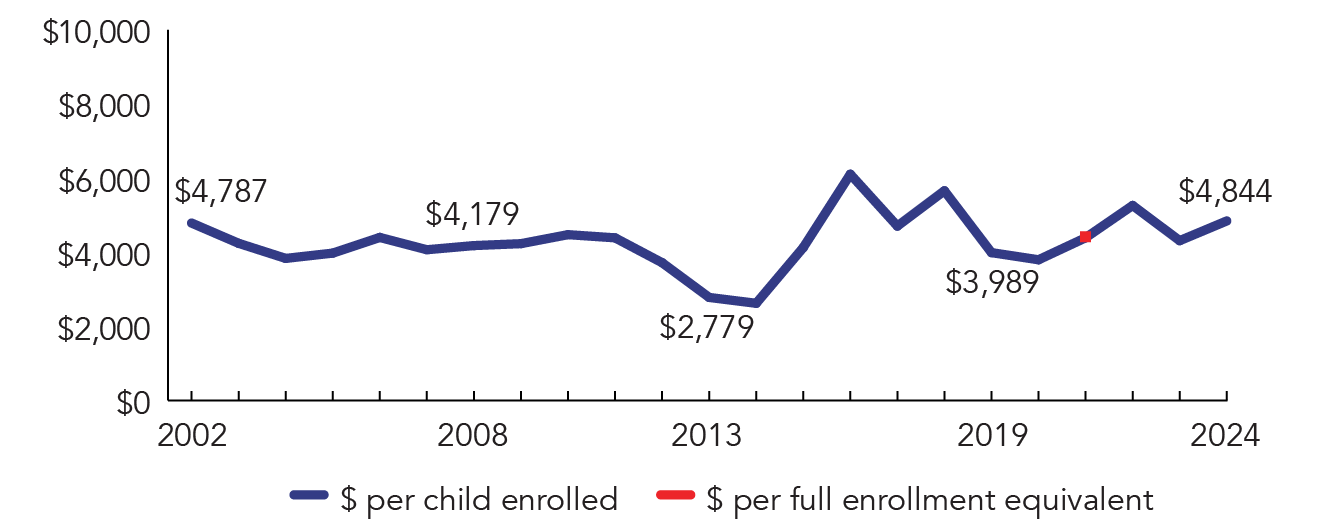
During the 2023-2024 school year, Missouri preschool enrolled 8,796 children, an increase of 2,421 from the prior year. State spending totaled $42,609,450, up $15,120,955 (55%), adjusted for inflation, since last year. State spending per child equaled $4,844 in 2023-2024 up $532 from 2022-2023, adjusted for inflation. Missouri met 4.3 of 10 quality standards benchmarks.
What's New
In 2023-2024, the state implemented an additional preschool program, Missouri Quality Preschool (MOQPK), which provided funding for both public schools and licensed private child care centers and preschools, unlike the state’s other pre-K program, Pre-K Foundation Formula that only operates in public schools. All MOQPK classrooms are observed every two years using CLASS. Lead teachers are required to have at least 18 college credits in early childhood education or child development and participate in coaching and complete 18 clock hours per year of professional development.
The Pre-K Foundation Formula program funds have doubled for the 2024-2025 school year. Districts are now able to claim 8% of their FRL population for Pre-K students, an increase of 4% from the previous year.
Background
Beginning in the 2018-2019 school year, Missouri’s Local Education Agencies (LEAs) were encouraged to use the Missouri Pre-K Foundation Formula fund for preschool. Most policy decisions are made by the LEAs but programs must meet requirements around teacher to child ratios, teacher degrees and certification, and fiscal spending and reporting.
Previously, the Missouri Preschool Program (MPP), launched in 1998, served 3- and 4-year-olds in public schools, private child-care centers, and nonprofit agencies. Programs were required to work with the local Parents as Teachers program to provide parent education, family visits, group connections, health and development screenings, and services referrals. MPP was funded through the state’s Tobacco Settlement Fund. Priority for funding was given to programs serving children with special needs or from low-income families. The 2020-2021 school year was the last year of operation for MPP.
-
Access

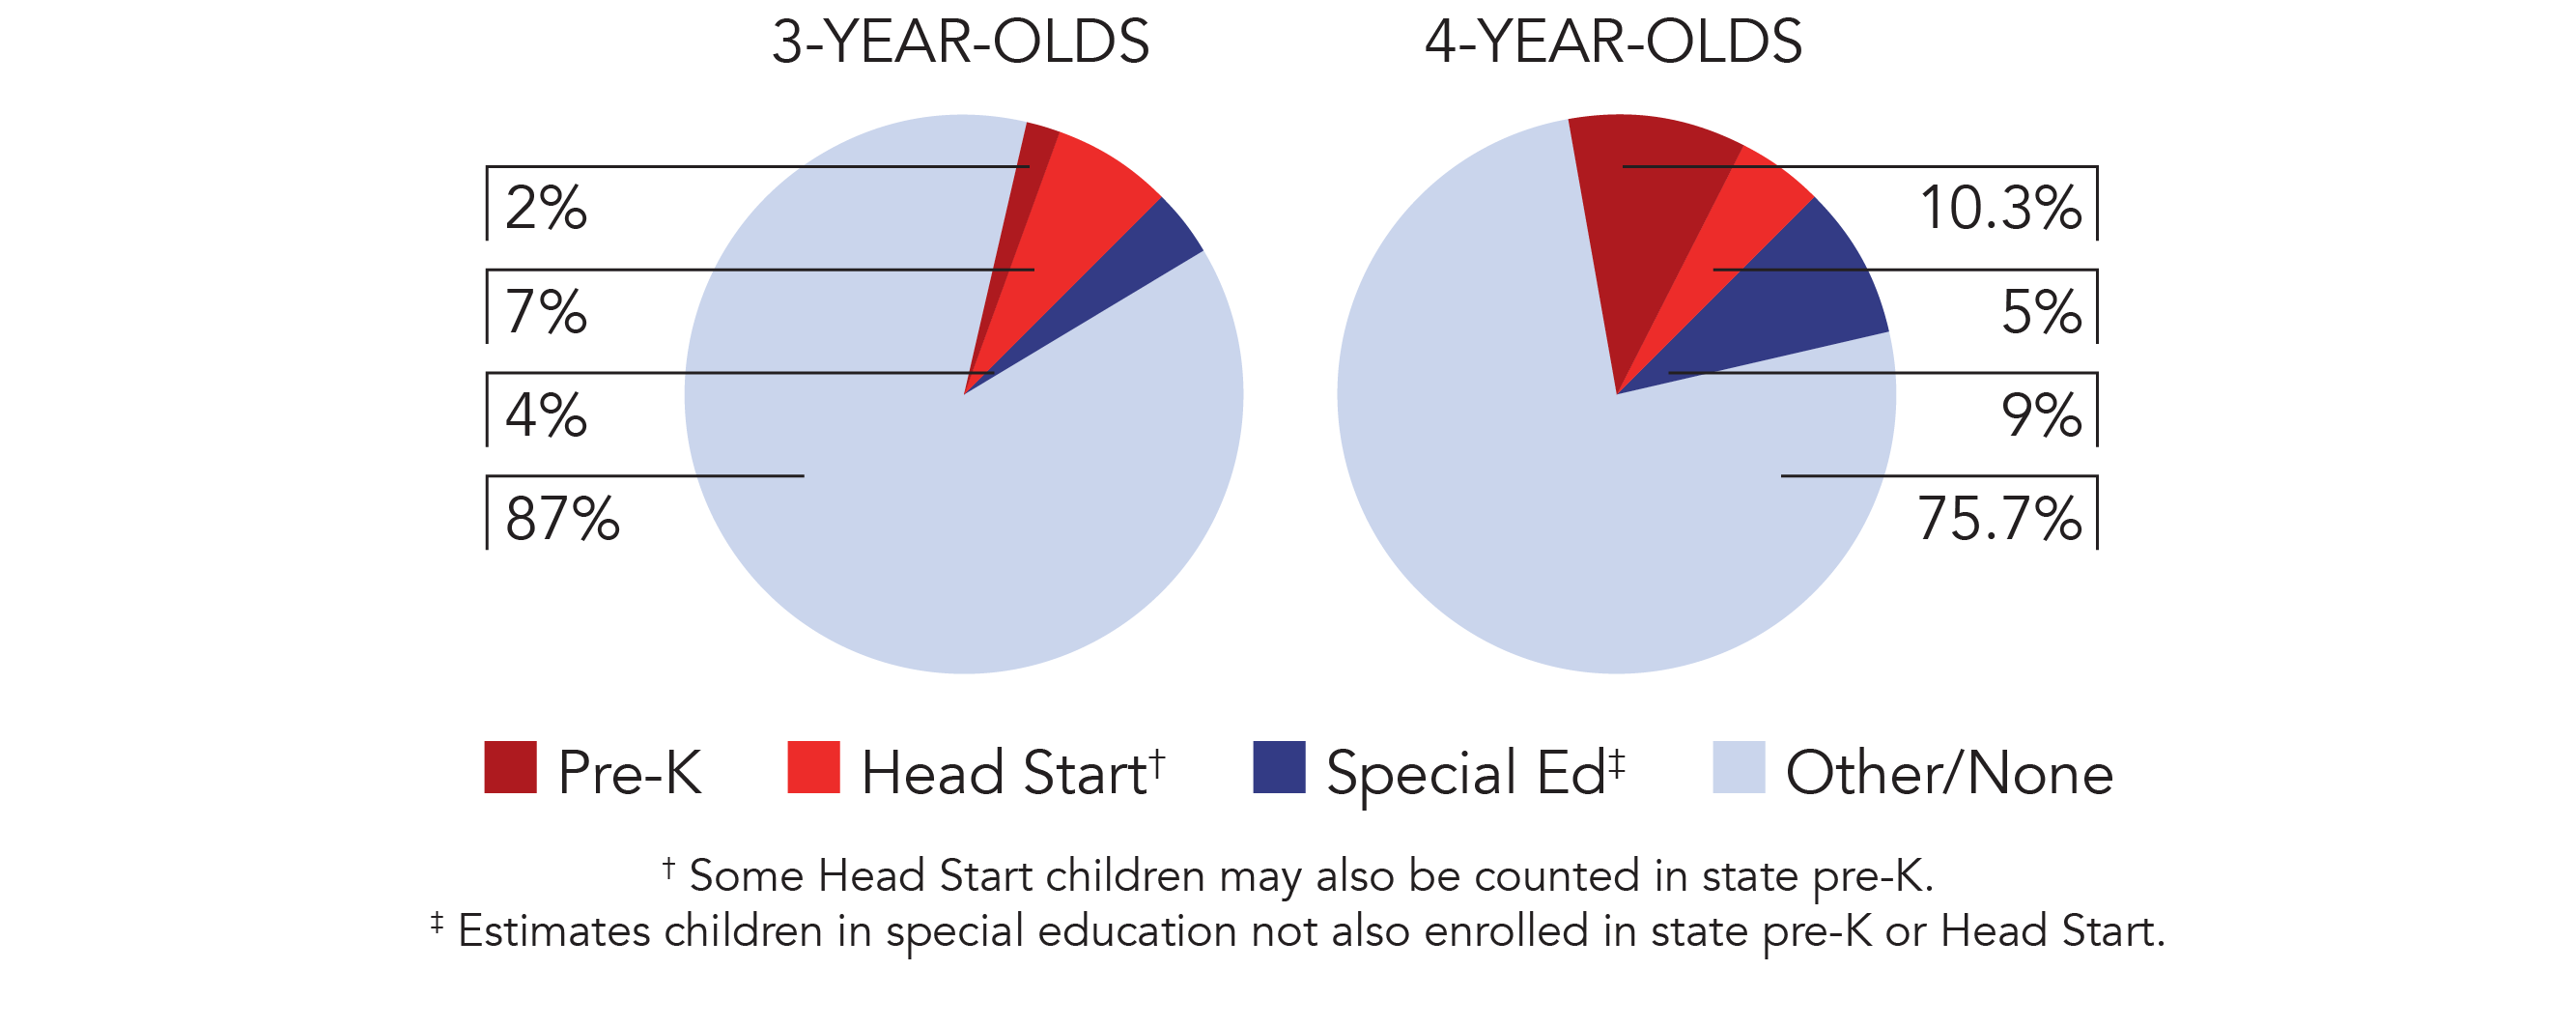
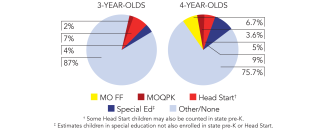
Total state pre-K enrollment 8,796 Special education enrollment, ages 3 and 4 11,765 Federally funded Head Start enrollment, ages 3 and 4 9,133 State-funded Head Start enrollment, ages 3 and 4 0 Resources
Total state pre-K spending $42,609,450 State Head Start spending $0 State spending per child enrolled $4,844 All reported spending per child enrolled* $4,844 
*Pre-K programs may receive additional funds from federal or local sources that are not included in this figure. †Head Start per-child spending includes funding only for 3- and 4-year-olds. ‡K–12 expenditures include capital spending as well as current operating expenditures.

-
Access
Total state pre-K enrollment 6,145 School districts that offer state program 35% (public school
districts); 57% (charter schools)Income requirement 185% FPL Minimum hours of operation Determined locally Operating schedule School or academic year Resources
Total state pre-K spending $30,077,040 Local match required? No State Head Start spending $0 State spending per child enrolled $4,895 All reported spending per child enrolled* $4,895 
*Pre-K programs may receive additional funds from federal or local sources that are not included in this figure. †Head Start per-child spending includes funding only for 3- and 4-year-olds. ‡K–12 expenditures include capital spending as well as current operating expenditures.


Missouri Pre-K Foundation Formula Quality Standards Checklist
| Policy | MO Foundation Formula Requirement | Benchmark | Meets Benchmark? |
|---|---|---|---|
For more information about the benchmarks, see the Executive Summary and the Roadmap to State pages. | 4benchmarks met | ||
| Early Learning & Development Standards Benchmark | Comprehensive, aligned, supported, culturally sensitive | Comprehensive, aligned, supported, culturally sensitive | |
| Curriculum Supports Benchmark | Approval process | Approval process & supports | |
| Teacher Degree Benchmark | BA | BA | |
| Teacher Specialized Training Benchmark | ECE, ECE SpEd | Specializing in pre-K | |
| Assistant Teacher Degree Benchmark | Other | CDA or equivalent | |
| Staff Professional Development Benchmark | 30 hours/year (teachers years 1-4), 15 hours/year (teachers year 5 until exempt); PD plans (some teachers); Coaching (some teachers) | For teachers & assistants: At least 15 hours/year; individual PD plans; coaching | |
| Maximum Class Size Benchmark | No limit (3- & 4-year-olds) | 20 or lower | |
| Staff to Child Ratio Benchmark | 1:10 (3- & 4-year-olds) | 1:10 or better | |
| Screening & Referral Benchmark | None | Vision, hearing & health screenings; & referral | |
| Continuous Quality Improvement System Benchmark | None | Structured classroom observations; data used for program improvement | |
-
Access
Total state pre-K enrollment 2,651 School districts that offer state program 27% (LEAs) Income requirement No income requirement Minimum hours of operation 3 hours/day Operating schedule School or academic year Resources
Total state pre-K spending $12,532,410 Local match required? No State Head Start spending $0 State spending per child enrolled $4,727 All reported spending per child enrolled* $4,727 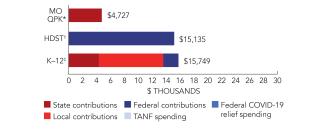
*Pre-K programs may receive additional funds from federal or local sources that are not included in this figure. †Head Start per-child spending includes funding only for 3- and 4-year-olds. ‡K–12 expenditures include capital spending as well as current operating expenditures.

Missouri Quality Preschool Grant (MOQPK) Quality Standards Checklist
| Policy | MOQPK Requirement | Benchmark | Meets Benchmark? |
|---|---|---|---|
For more information about the benchmarks, see the Executive Summary and the Roadmap to State pages. | 5benchmarks met | ||
| Early Learning & Development Standards Benchmark | Comprehensive, aligned, supported, culturally sensitive | Comprehensive, aligned, supported, culturally sensitive | |
| Curriculum Supports Benchmark | Approval process | Approval process & supports | |
| Teacher Degree Benchmark | Other | BA | |
| Teacher Specialized Training Benchmark | 18 ECE/CD credits | Specializing in pre-K | |
| Assistant Teacher Degree Benchmark | Other | CDA or equivalent | |
| Staff Professional Development Benchmark | 18 hours/year; Coaching | For teachers & assistants: At least 15 hours/year; individual PD plans; coaching | |
| Maximum Class Size Benchmark | 20 (4-year-olds) | 20 or lower | |
| Staff to Child Ratio Benchmark | 1:10 (4-year-olds) | 1:10 or better | |
| Screening & Referral Benchmark | Developmental; Referrals not required | Vision, hearing & health screenings; & referral | |
| Continuous Quality Improvement System Benchmark | Structured classroom observations; Data used for program improvement* | Structured classroom observations; data used for program improvement | |