State of Preschool
Maryland
Access Rankings
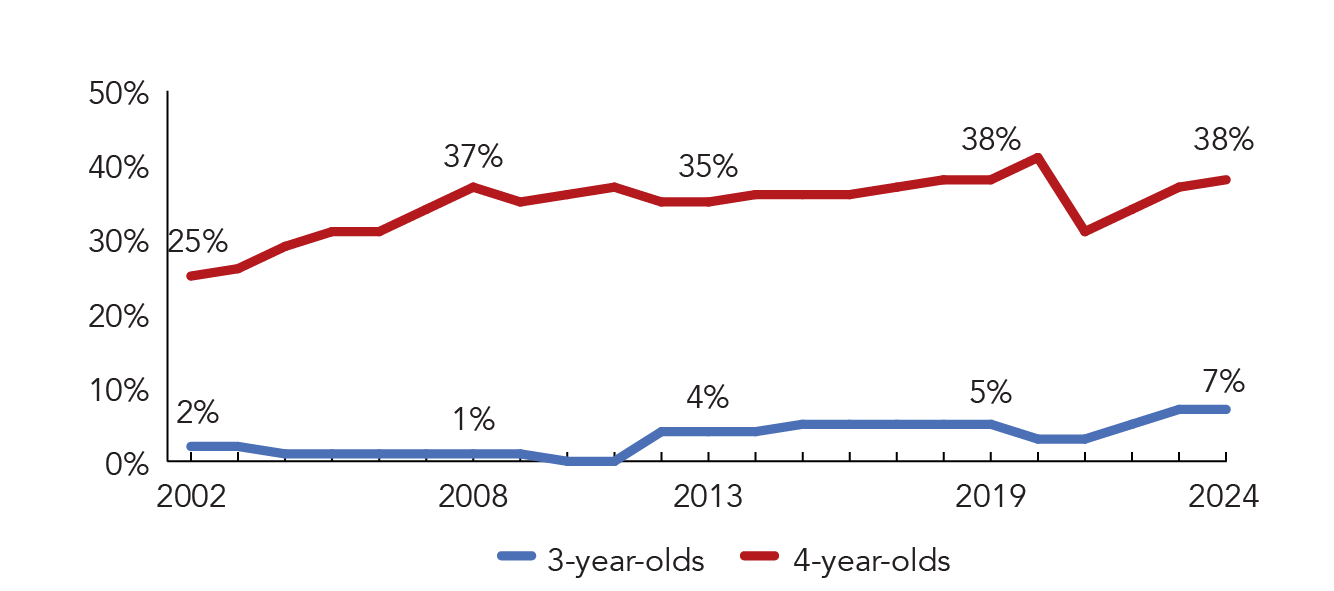
4-year-Olds
18
3-year-Olds
20
Resource Rankings
State spending
9
All reported spending
4
Total Benchmarks Met
Of 10 benchmarks possible
8
Overview
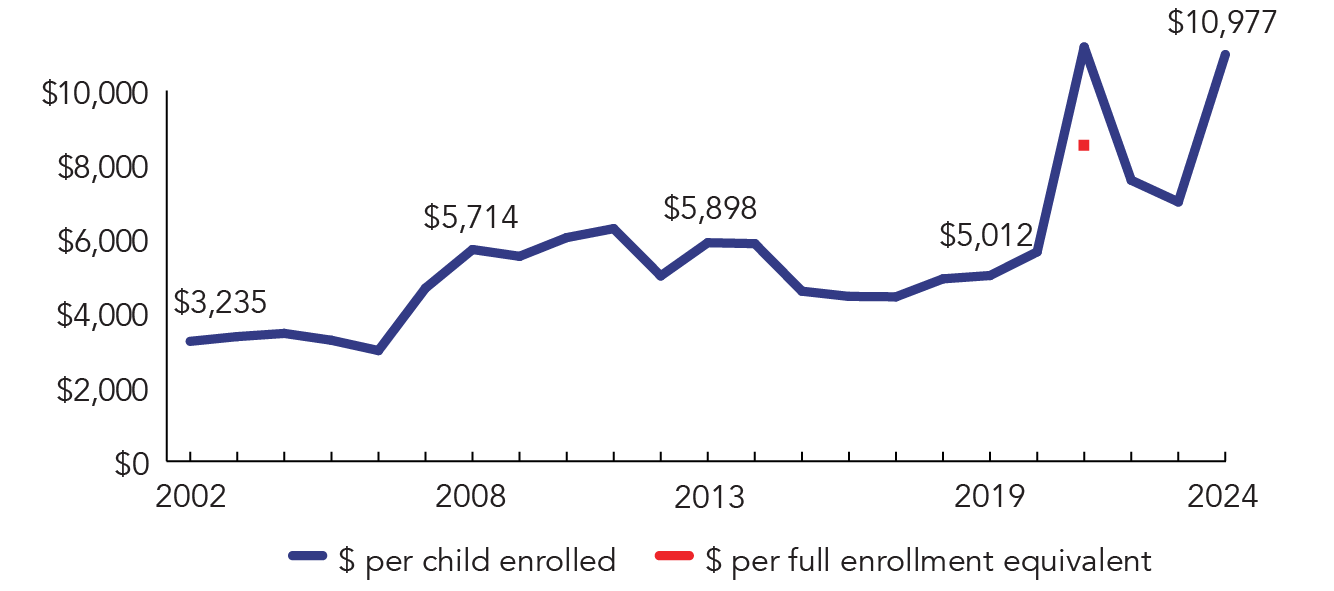
During the 2023-2024 school year, Maryland preschool enrolled 32,972 children, an increase of 1,065 from the prior year. State spending totaled $358,063,870 and an additional $3,854,423 in federal recovery funds supported the program, up $138,649,029 (62%), adjusted for inflation, since last year. State spending per child (including federal recover funds) equaled $10,977 in 2023-2024, up $3,979 from 2022-2023, adjusted for inflation. Maryland met 8 of 10 quality standards benchmarks.
What's New
During the 2023-2024 school year, Maryland increased efforts to include more programs in the Maryland Prekindergarten Program, specifically child care centers, family child care homes, and Head Start programs. Maryland has launched an awareness campaign entitled “Push to Pre-K” to provide information and support to programs seeking to participate in the state program, per the Blueprint for Maryland’s Future. Targeted outreach and technical assistance are provided to support private providers to successfully enter the program.
Enrollment in the Maryland Prekindergarten Program also continues to increase. Legislative changes and enhancements that support the Blueprint for Maryland’s Future have provided the opportunity for this growth. House Bills were passed to expand pathways to qualify as a lead teacher and assistant teacher allowing more programs to meet eligibility requirements. Additionally, a House Bill that ensures participating Head Start programs receive full per-child funding, increasing the opportunity to blend and braid Head Start and state Prekindergarten funds.
Background
Maryland created the Extended Elementary Education Program (EEEP) in 1980 as a pilot preschool program in Baltimore City and Prince George’s County. The Maryland Prekindergarten Program was started in 2002, giving local boards of education until 2007 to provide pre-K in public schools to all 4-year-olds from families with incomes at or below 185% FPL. Maryland enacted the Prekindergarten Expansion Act in 2014, adding $4.3 million per year to increase access to full-day public pre-K for 4-year-olds from families with household incomes up to 300% FPL.
The Division of Early Childhood (DEC) in the MSDE is responsible for early care and education. Funding for the Maryland Prekindergarten Program is provided through a school funding formula and is based on the K–12 per pupil amount, to support eligible children attending half-day programs. DEC staff monitor pre-K programs funded through the Prekindergarten Expansion Grants annually, using a self-developed checklist. Prekindergarten Expansion Grantees are required to participate in Maryland EXCELS, the state’s QRIS, and are able to access targeted technical assistance.
Maryland also has “Judy Centers” located in Title 1 schools that work collaboratively with elementary schools and community-based providers to offer comprehensive, year-round early learning services for children birth to age five.
Maryland Prekindergarten Program
Access
| |
| Total state pre-K enrollment | 32,972 |
| School districts that offer state program | 100% |
| Income requirement | 185% FPL (part-day); 300% FPL (full-day) |
| Minimum hours of operation | 2.5 hours/day; 5 days/week |
| Operating schedule | School or academic year |
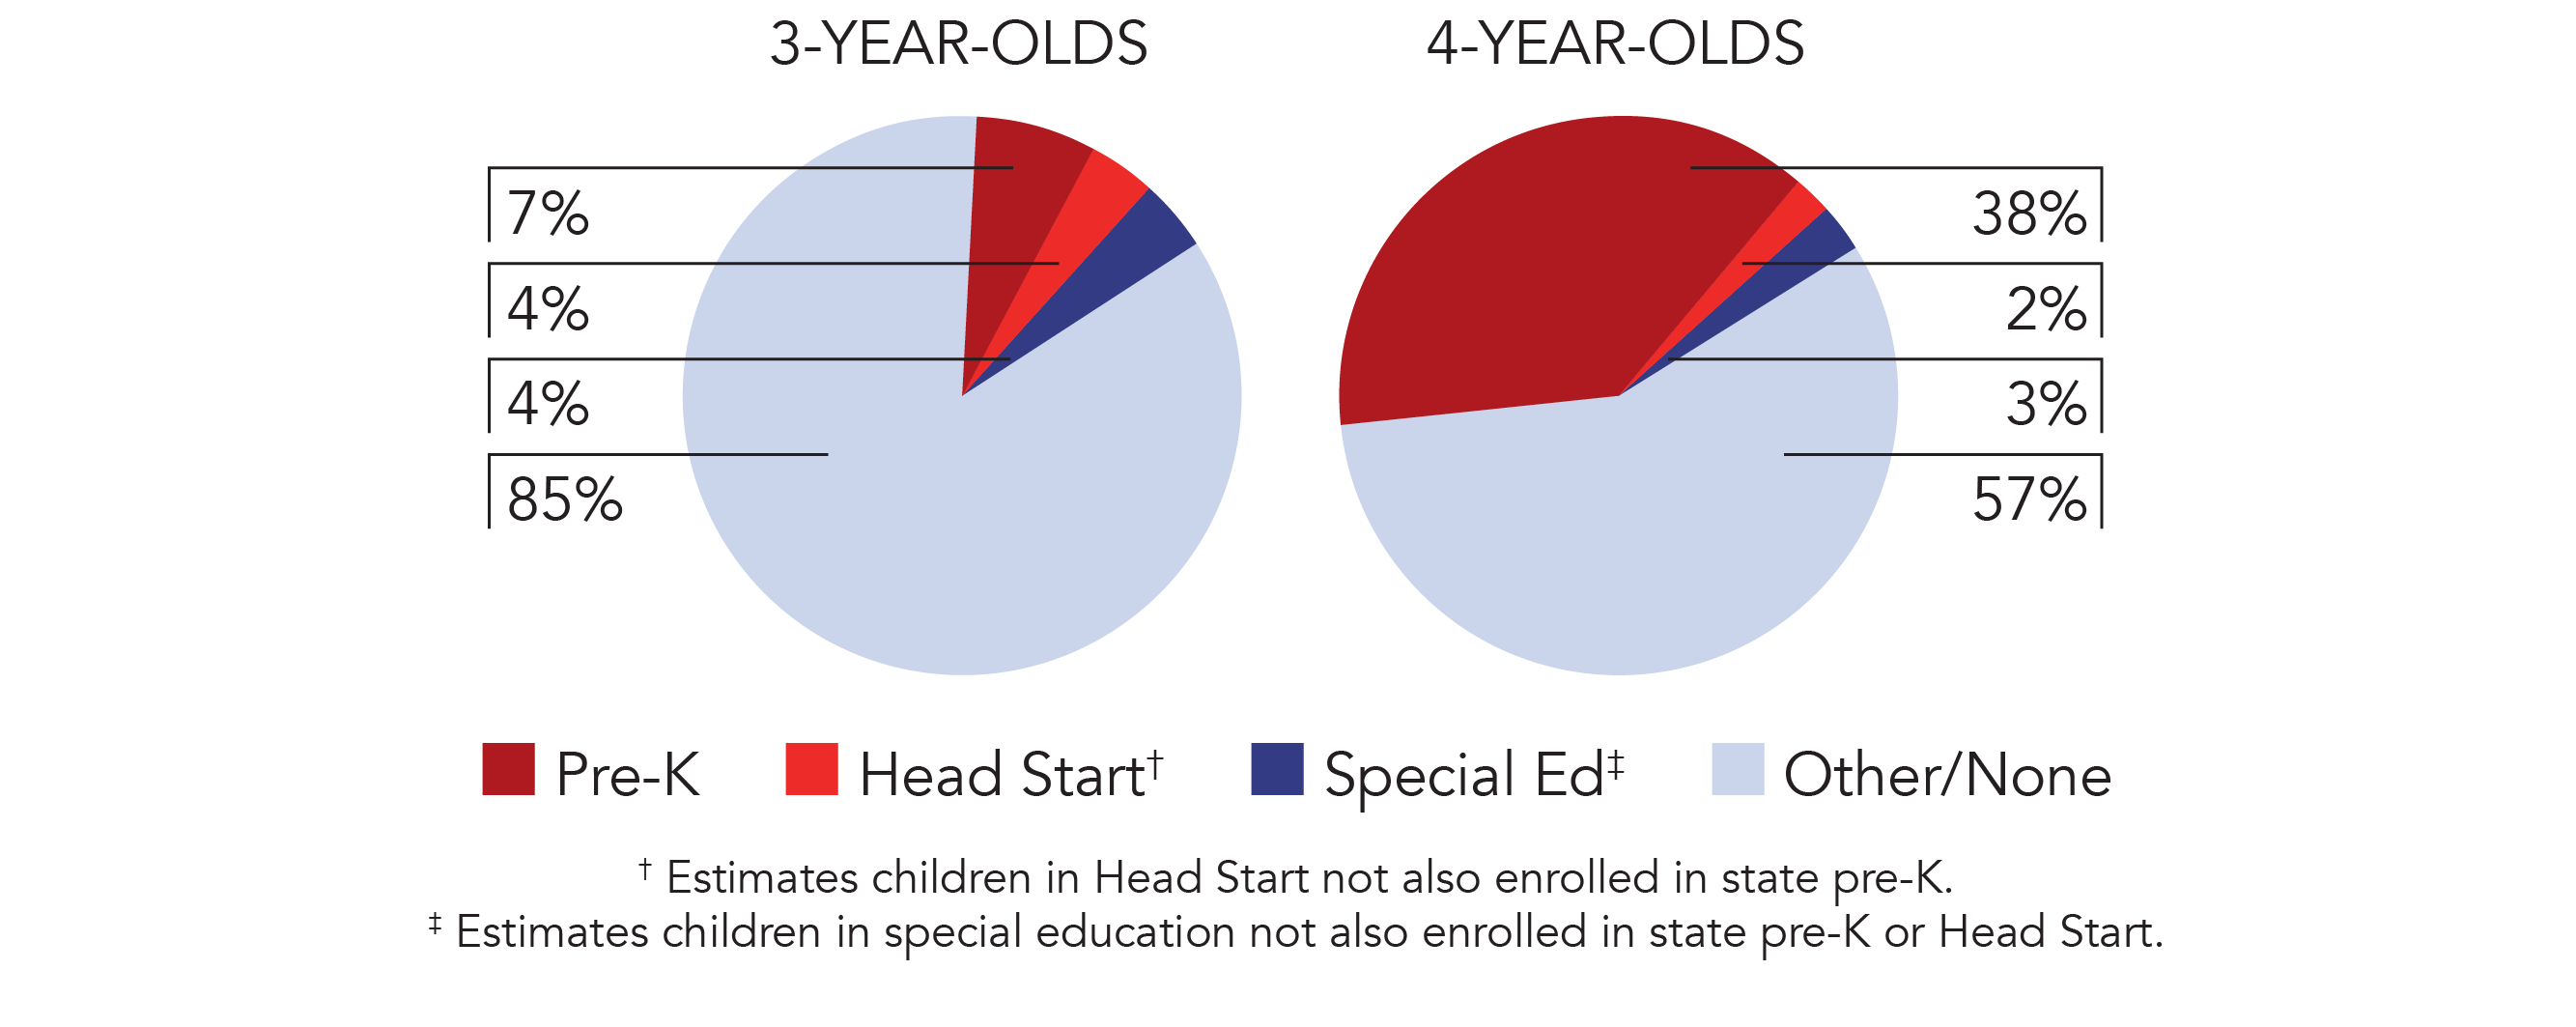
| Special education enrollment, ages 3 and 4 | 10,962 |
| Federally funded Head Start enrollment, ages 3 and 4 | 5,174 |
| State-funded Head Start enrollment, ages 3 and 4 | 0 |
Resources
| Total state pre-K spending | $361,918,293 |
| Local match required? | No |
| State Head Start spending | $2,440,960 |
| State spending per child enrolled | $10,977 |
| All reported spending per child enrolled* | $17,262 |
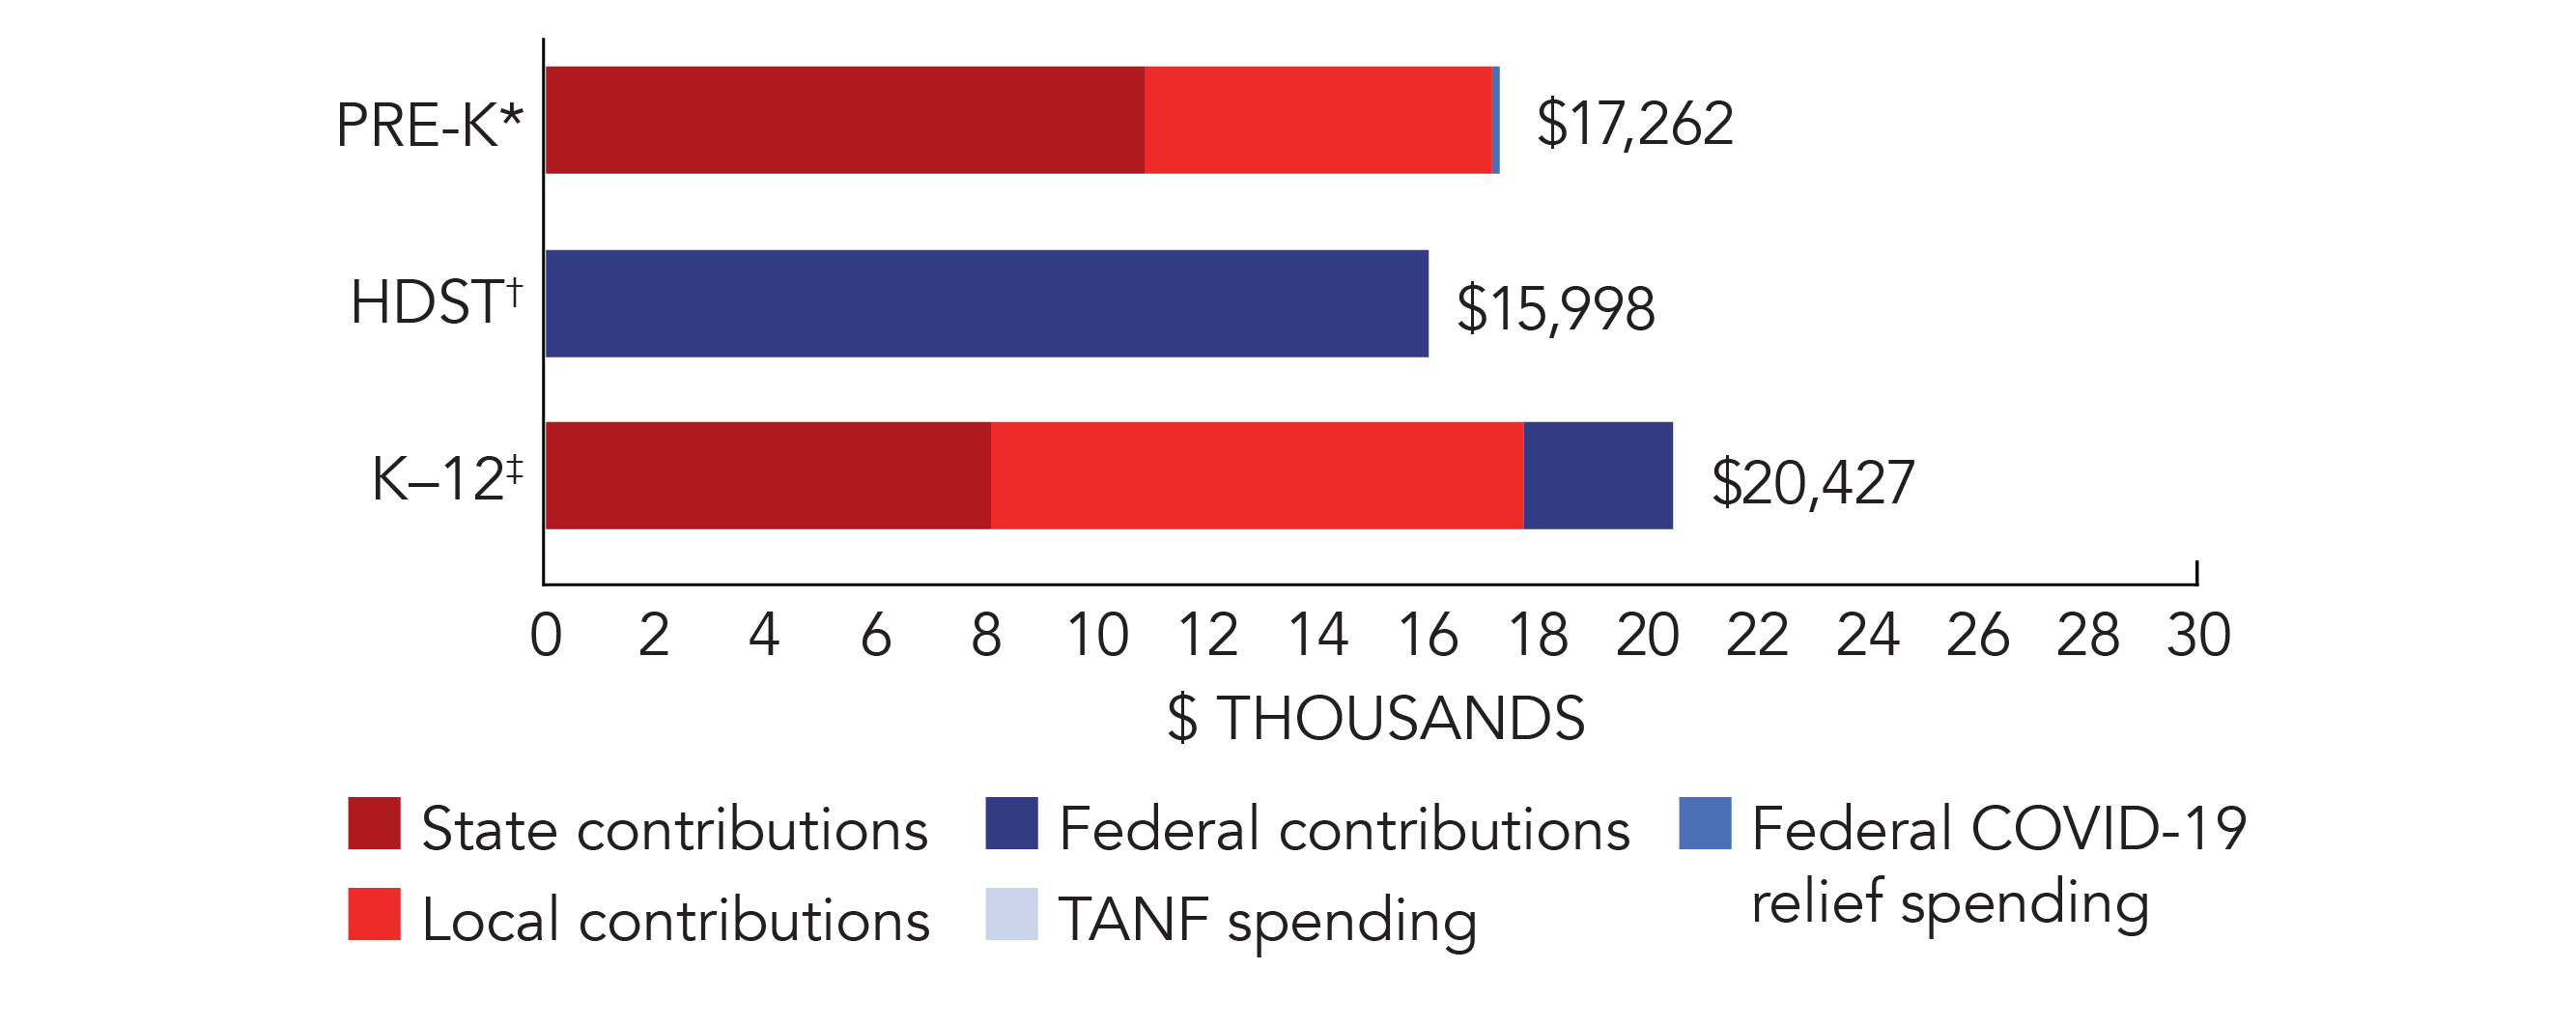
*Pre-K programs may receive additional funds from federal or local sources that are not included in this figure. †Head Start per-child spending includes funding only for 3- and 4-year-olds. ‡K–12 expenditures include capital spending as well as current operating expenditures.
Maryland Quality Standards Checklist
| Policy | Requirement | Benchmark | Meets Benchmark? |
|---|---|---|---|
For more information about the benchmarks, see the Executive Summary and the Roadmap to State pages. | 8benchmarks met | ||
| Early Learning & Development Standards Benchmark | Comprehensive, aligned, supported, culturally sensitive | Comprehensive, aligned, supported, culturally sensitive | |
| Curriculum Supports Benchmark | Approval process & supports | Approval process & supports | |
| Teacher Degree Benchmark | BA | BA | |
| Teacher Specialized Training Benchmark | ECE | Specializing in pre-K | |
| Assistant Teacher Degree Benchmark | HSD | CDA or equivalent | |
| Staff Professional Development Benchmark | 6 credit hours/5 years (teachers); 24 hours/year (assistants); PD plans | For teachers & assistants: At least 15 hours/year; individual PD plans; coaching | |
| Maximum Class Size Benchmark | 20 (3- & 4-year-olds) | 20 or lower | |
| Staff to Child Ratio Benchmark | 1:10 (3- & 4-year-olds) | 1:10 or better | |
| Screening & Referral Benchmark | Vision, hearing, health & more | Vision, hearing & health screenings; & referral | |
| Continuous Quality Improvement System Benchmark | Structured classroom observations; Data used for program improvement | Structured classroom observations; data used for program improvement | |