State of Preschool
District of Columbia
Access Rankings
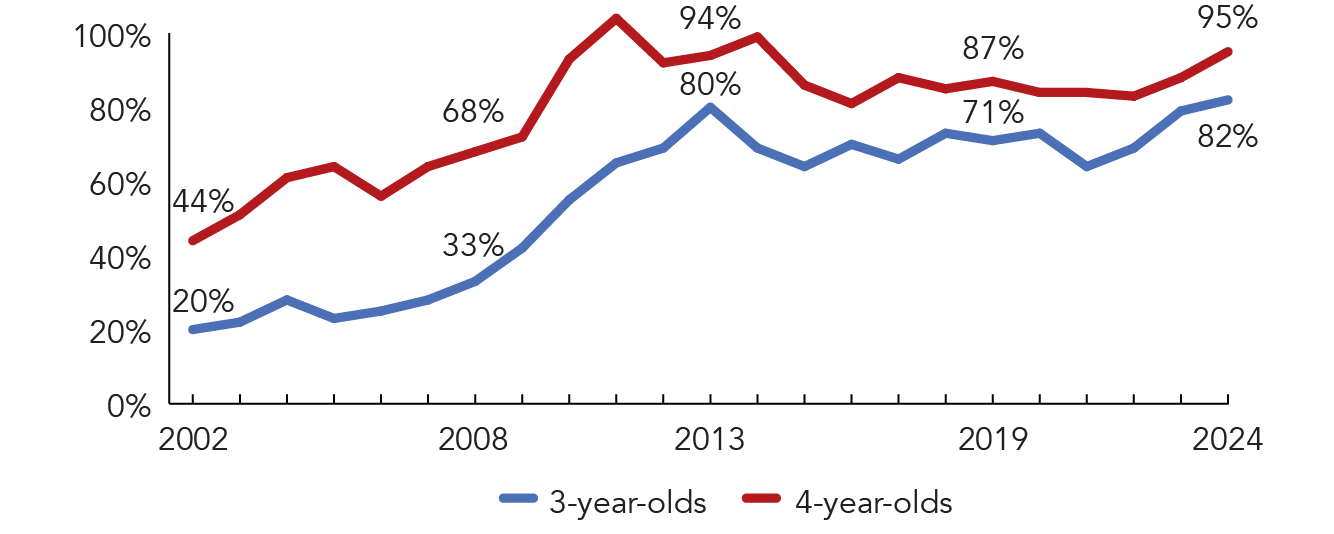
4-year-Olds
1
3-year-Olds
1
Resource Rankings
State spending
1
All reported spending
1
Total Benchmarks Met
Of 10 benchmarks possible
4
Overview
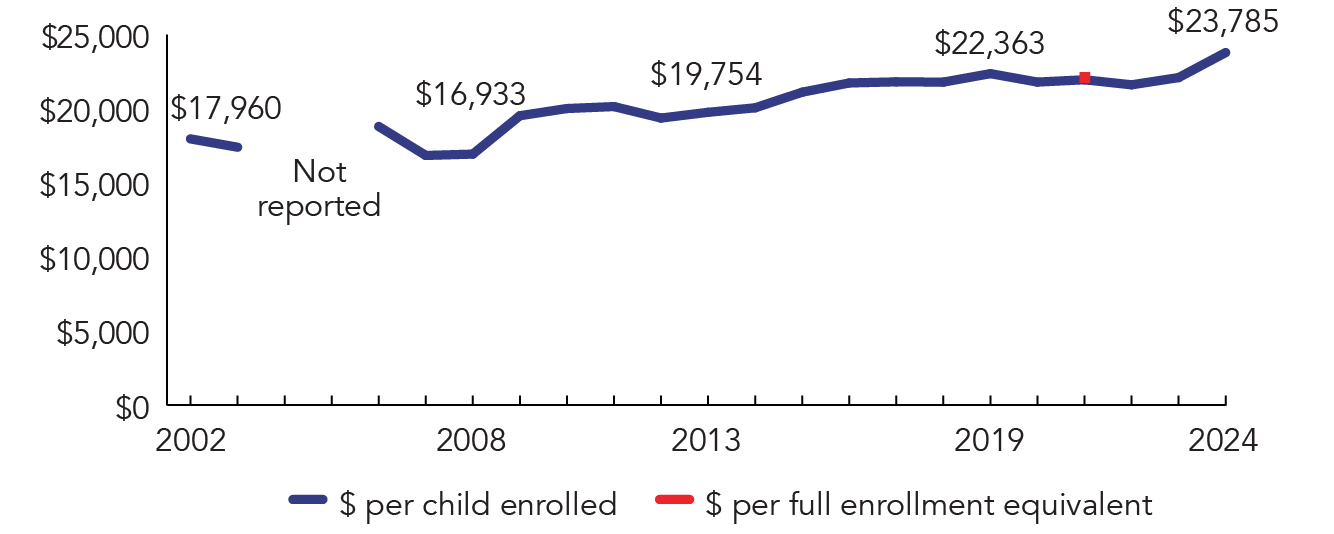
During the 2023-2024 school year, the District of Columbia preschool enrolled 13,219 children, an increase of 430 from the prior year. Spending totaled $314,419,667, up $31,820,962 (11%), adjusted for inflation, since last year. Spending per child equaled $23,785 in 2023-2024, up $1,688 from 2022-2023, adjusted for inflation. The District of Columbia met 4 of 10 quality standards benchmarks.
What's New
In September 2024, the District of Columbia was awarded a 3-year federal renewal Preschool Development Grant B-5 (PDG B-5) totaling almost $5 million annually. The PDG B-5 renewal grant will enhance the District’s efforts to advance the early learning workforce by providing: (1) postsecondary scholarships through the DC Leading Educators toward Advanced Degrees (DC LEAD) program, helping child care educators meet education and training requirements; (2) compensation through the Early Childhood Educator Pay Equity Fund for educators working with young children; (3) collaboration across DC Public Schools, public charter schools, licensed child development facilities and the Healthy Futures and Strong Start programs to pilot innovative strategies that enhance support for educators, families, and early learners; and (4) accelerated implementation of the Pyramid Model to promote social-emotional development of children with disabilities and developmental delays through Strong Start DC, the District’s early intervention program. In FY25, the DC Council increased funding for the Pre-K Enhancement and Expansion program (PKEEP) by $9 million to keep the program whole in light of an increase in the Universal Per Student Funding Formula (UPSFF) and increased enrollment over several years.
Background
Among the first in the nation to invest in early education, the District has offered pre-K since the 1960s. The District began to bolster its investment in pre-K significantly through the Pre-K Enhancement and Expansion Amendment Act of 2008 (Pre-K Act). The Pre-K Act provides public, quality, universally accessible pre-K via a mixed-delivery system in the District of Columbia Public Schools (DCPS), Public Charter Schools (PCS), and publicly-funded Community Based Organizations (CBOs) that participate in PKEEP. The Office of the State Superintendent of Education (OSSE) oversees the District’s Universal Pre-K Program, including programs in DCPS and CBOs. PCSs are authorized and monitored by the DC Public Charter School Board (PCSB). Additionally, the District’s Head Start and Early Head Start grantees serve thousands of children and their families; all District Head Start grantees also participate in the universal pre-K system, but may also serve children not eligible for public pre-K.
Pre-K programs operate a minimum of 6.5 hours per day, five days a week, 180 instructional days per year. Given the high availability and participation, this program can be considered universal. Funding for public pre-K programs is based on the Uniform Per Student Funding Formula.
Program quality is measured using the CLASS Pre-K, which informs a school rating that is included on each school’s DC School Report Card. The PCSB also uses CLASS Pre-K in its Performance Management Framework, which provides all PCS with an annual score. For CBOs, CLASS Pre-K assessments are used for Capital Quality, the District’s QRIS. In the 2023-2024 school year CLASS observations were conducted in 976 pre-K classrooms. CLASS scores in the Instructional Support domain increased since the 2022- 2023 school year. CLASS scores across all domains remain higher since the 2017-2018 school year, demonstrating a trend of improvement over time. Performance across sectors was strong with variation in performance among classrooms within each sector (DCPS, PCS and CBOs) greater than variations between sectors.
District of Columbia Universal Pre-K
Access
| |
| Total state pre-K enrollment | 13,219 |
| School districts that offer state program | 100% (wards) |
| Income requirement | No income requirement |
| Minimum hours of operation | 6.5 hours/day; 5 days/week |
| Operating schedule | School or academic year |
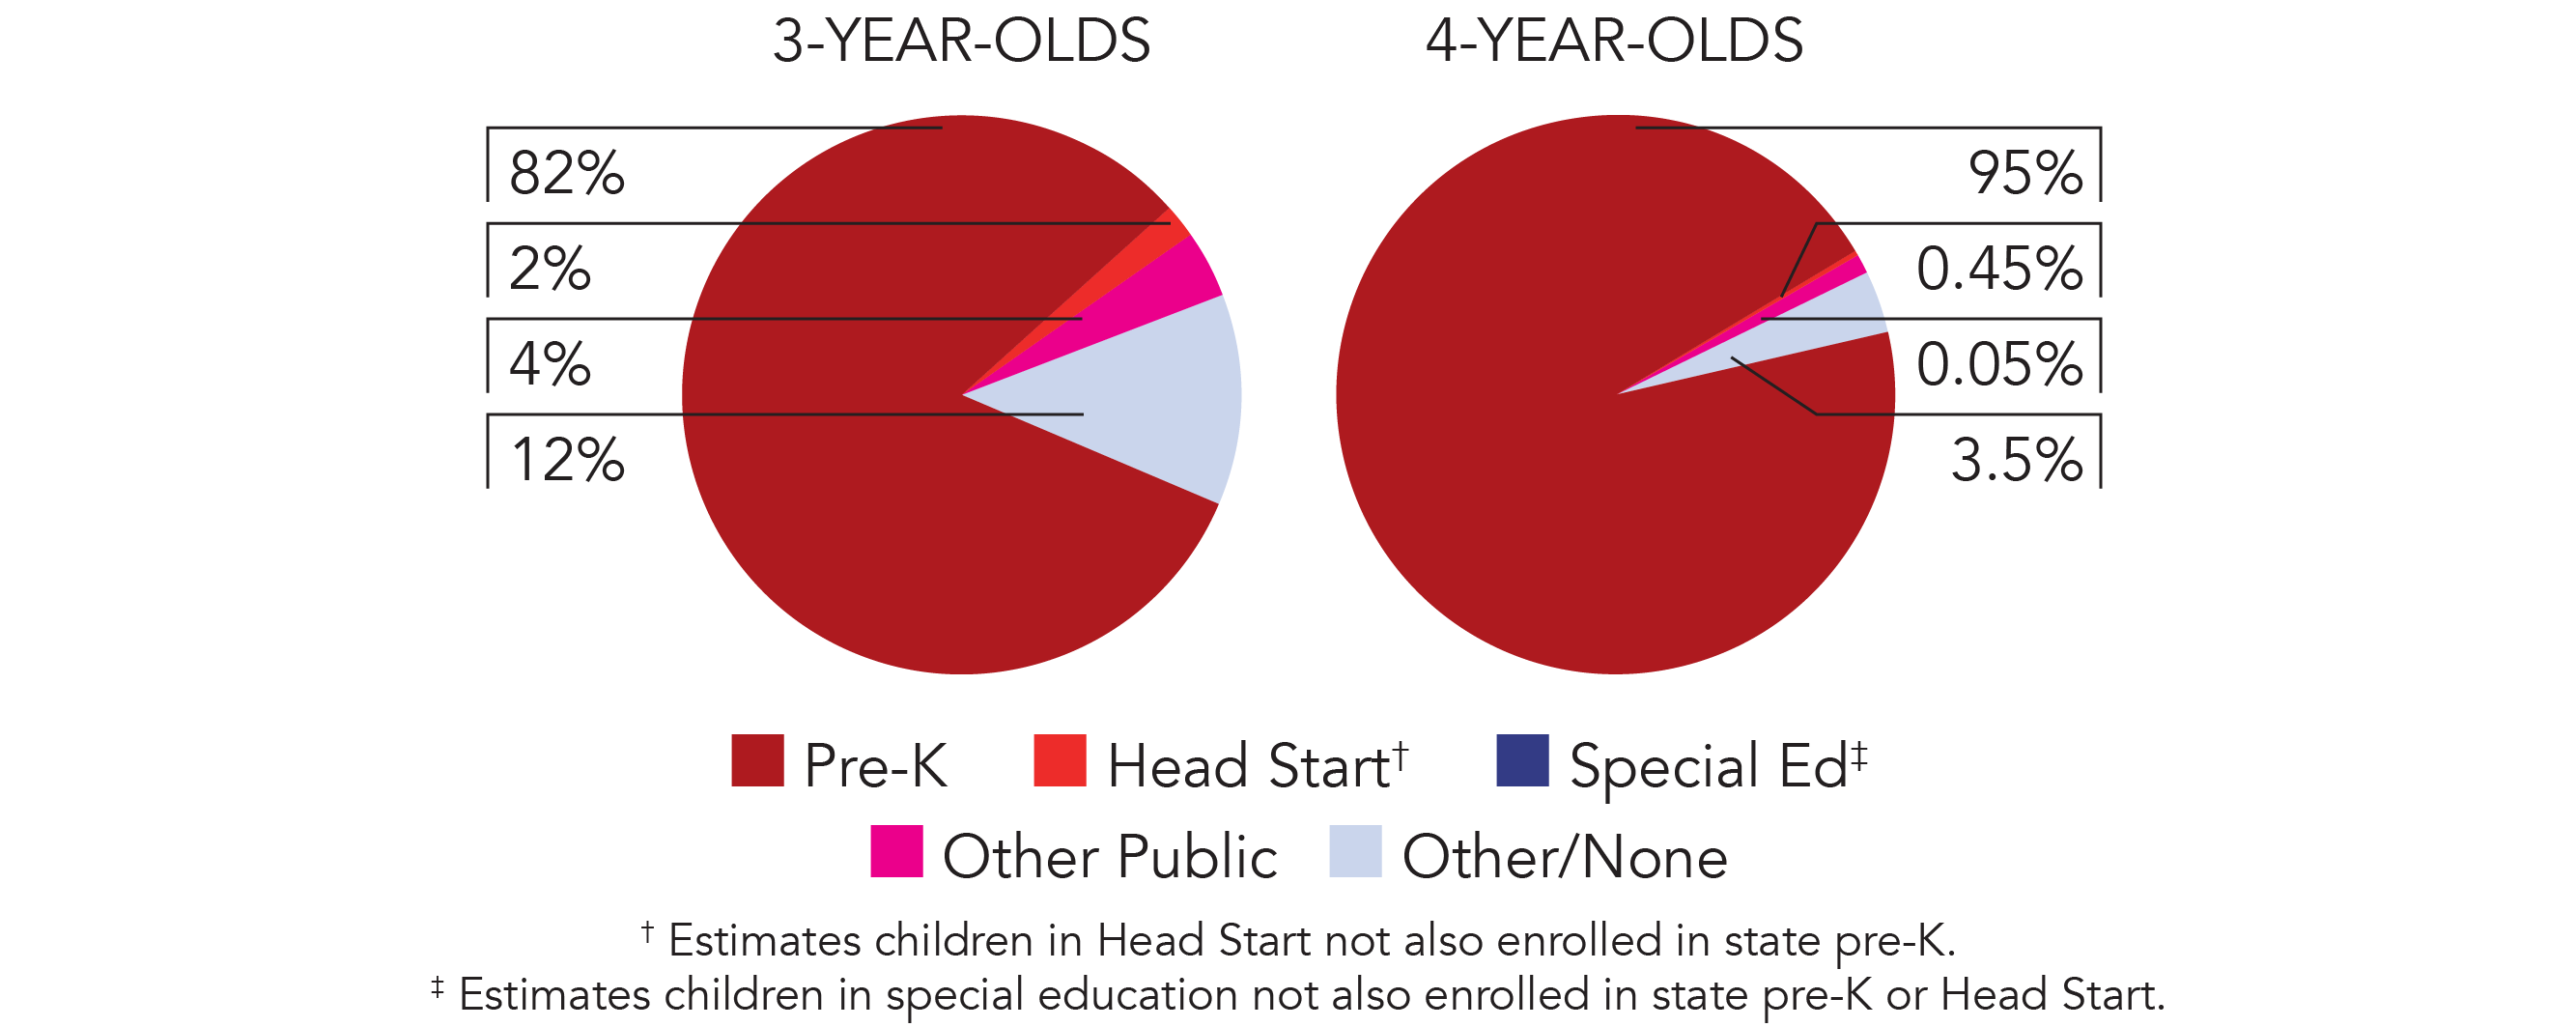
| Special education enrollment, ages 3 and 4 | 1,697 |
| Federally funded Head Start enrollment, ages 3 and 4 | 424 |
| State-funded Head Start enrollment, ages 3 and 4 | 0 |
Resources
| Total state pre-K spending | $314,419,667 |
| Local match required? | No |
| State Head Start spending | $0 |
| State spending per child enrolled | $23,785 |
| All reported spending per child enrolled* | $23,785 |
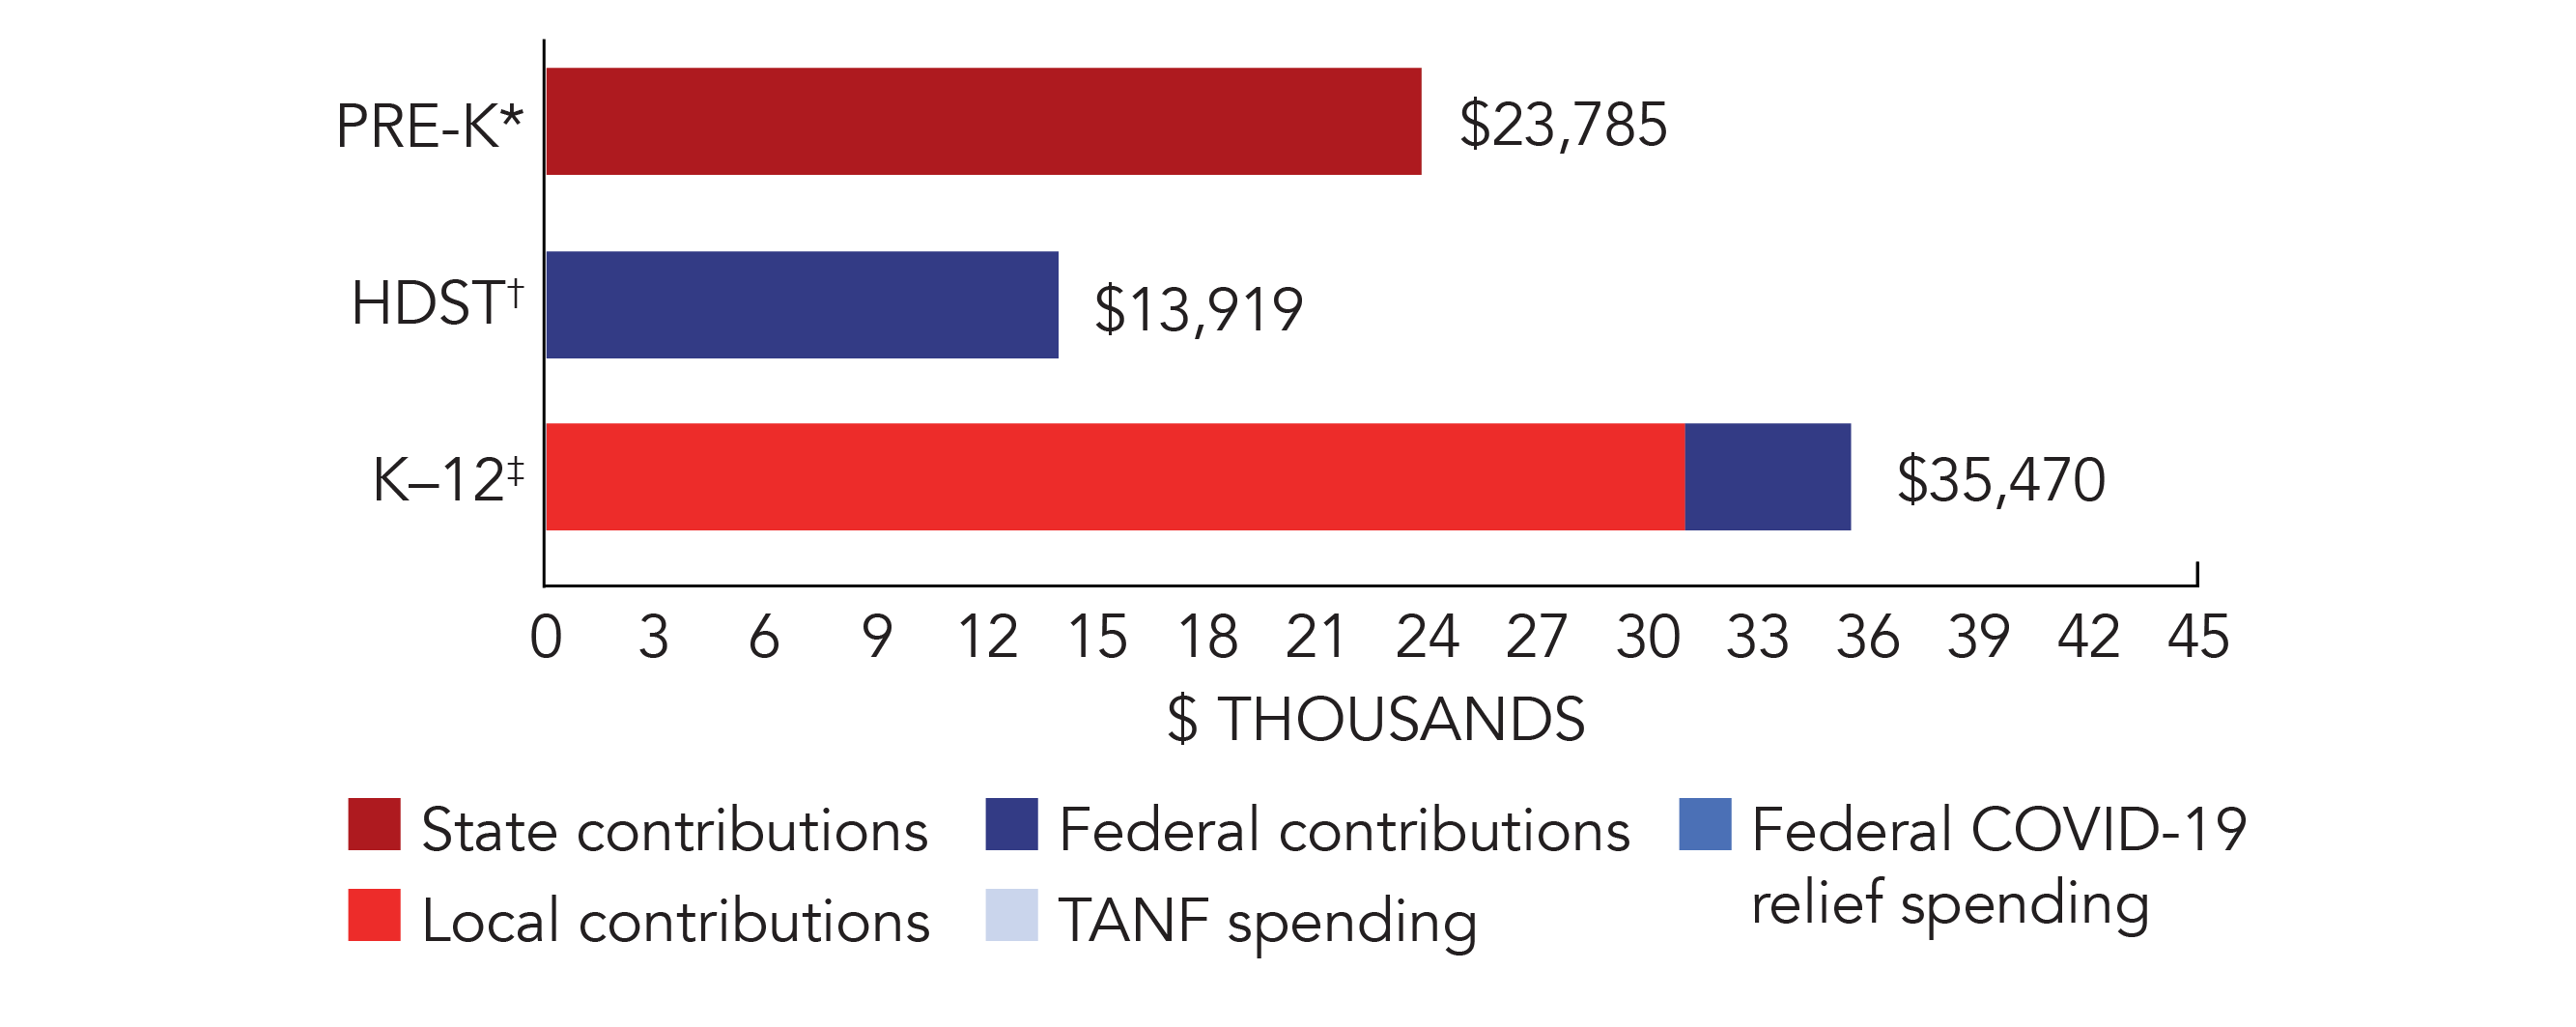
*Pre-K programs may receive additional funds from federal or local sources that are not included in this figure. †Head Start per-child spending includes funding only for 3- and 4-year-olds. ‡K–12 expenditures include capital spending as well as current operating expenditures.
District of Columbia Quality Standards Checklist
| Policy | Requirement | Benchmark | Meets Benchmark? |
|---|---|---|---|
For more information about the benchmarks, see the Executive Summary and the Roadmap to State pages. | 4benchmarks met | ||
| Early Learning & Development Standards Benchmark | Comprehensive, aligned, supported, culturally sensitive | Comprehensive, aligned, supported, culturally sensitive | |
| Curriculum Supports Benchmark | Approval process & supports | Approval process & supports | |
| Teacher Degree Benchmark | BA (DCPS & CBO); Determined locally (PCS) | BA | |
| Teacher Specialized Training Benchmark | ECE, CD, Elem. Ed., (DCPS); ECE or related field (CBO); Determined locally (PCS) | Specializing in pre-K | |
| Assistant Teacher Degree Benchmark | AA or Paraprofessional Certification (DCPS); AA (CBO); Determined locally (PCS) | CDA or equivalent | |
| Staff Professional Development Benchmark | 30 hours/year (DCPS teachers); 21 hours/year (CBO teachers & assistants); PD plans (Head Start teachers & CBO teachers & assistants); Coaching (DCPS) | For teachers & assistants: At least 15 hours/year; individual PD plans; coaching | |
| Maximum Class Size Benchmark | DCPS & CBO only: 16 (3-year-olds); 20 (4-year-olds) | 20 or lower | |
| Staff to Child Ratio Benchmark | DCPS & CBO only: 1:8 (3-year-olds); 1:10 (4-year-olds) | 1:10 or better | |
| Screening & Referral Benchmark | Vision, hearing, health & more | Vision, hearing & health screenings; & referral | |
| Continuous Quality Improvement System Benchmark | Structured classroom observations; Data used for program improvement | Structured classroom observations; data used for program improvement | |