Widening Gap in Pre-K Access
Haves and Have Nots
April 17, 2012
Mountains of evidence over years of study have shown that high-quality preschool education helps put kids on the right track for future success in school and beyond, especially those children from low-income families or facing other challenges that put them at a disadvantage. It could not be clearer, though, from our 2011 State Preschool Yearbook that the disparities in state-funded pre-K are so great as to exacerbate lifelong inequalities among children.
As Secretary of Education Arne Duncan explained at the Yearbook 2011 release, “High-quality early learning is what we want for our own children—which means that it must be what we want for all children.” Despite the impressive enrollment growth in state-funded preschool—nearly doubling to 1.3 million children in a decade—recession-driven funding cuts have made it difficult to give this opportunity to all children.
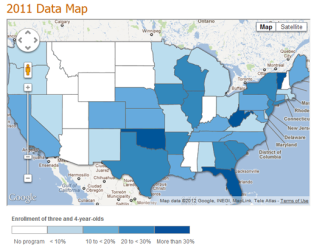
Using data from the 2011 Yearbook, GOVERNING Magazine created a map that highlights these disparities. States are shaded based on the percent of their 3- and 4-year-old population served in state-funded pre-K. Eleven states offered no state-funded pre-K in the 2010-2011 school year, including Arizona, which became the first state to completely remove it state-funded pre-K program. Of the 39 states that do provide these programs, an additional 15 did not enroll 3-year-olds, which drives down their percentage served compared to the measure of 4-year-olds served. For example, Florida is ranked number 1 in enrollment for reaching 76 percent of its 4-year-olds, a percentage that is slashed in half to 38 percent when combined with 3-year-olds.

This map is a great tool for some quick looks at regional trends—you can quickly see the “hot spots” for enrollment, including the Wisconsin-Illinois-Iowa trio in the Midwest; the “not so hot spots,” such as the Midwest duo of Michigan and Ohio; and the cold spots, including seven Western states that do not offer programs at all. Additional details on enrollment and spending can be found by clicking on the individual state.
Enrollment, however, only tells part of the story: programs of high-quality are necessary to guarantee long-term gains, but quality varies startlingly from state to state. During the 2010-2011 year, only five states met all 10 of our quality standards benchmarks (Alabama, Alaska, Georgia, North Carolina, and Rhode Island), while at the other end of the spectrum, Ohio met only 2. California and Florida met only 3 benchmarks each, which is particularly concerning given that these programs serve each serve more than 100,000 children, including large populations of Hispanic children.
How many preschoolers a program can enroll and what program standards it can effectively meet (i.e., not just on paper) are inherently linked to the funding available. Disparities in resources across states have persisted, contributing to the “haves” and “have nots” in state-funded pre-K. In the report’s executive summary, we say, “Disparities among the states in funding per child are substantial and persistent. In 2001, the difference in spending per child from the highest spending state to the lowest was nearly $9,000. Today, the range is more than $10,000. Massachusetts and Ohio had erratic changes in spending from one year to the next over the decade, but both states ended the period with decreases in pre-K spending of more than $3,000. By contrast, Arkansas and Maryland increased per-child spending over the decade by more than $2,000 each.” Quality, enrollment, and resources do not exist in a vacuum—each factor influences the others in ways that differ by state, but it is clear that too many states are not providing enough per-child funding to ensure quality for the children enrolled in their pre-K programs.
In order to explore these trends more fully, we’ve created a Google Motion chart of interactive Yearbook data. We encourage you to use this animated tool to explore pre-loaded variables on quality, access, and resources across states; you can select a particular state of interest to track its progress relative to other states.
[youtube http://www.youtube.com/watch?v=RNThfLkh0uk]Using our interactive data set via Google Motion Charts, the video above demonstrates the relationship between quality standards met by a state and the state per-child spending over time. On the whole, it’s clear that states have shifted toward meeting more quality standards in 2010-2011 than they did in 2001-2002, though per-child funding has by and large stayed below what is needed to implement these standards and ensure teachers are paid a competitive wage, as presented in Table 7 of the Yearbook.
Education has always been largely funded and controlled at state and local levels, which allows for greater flexibility and a focus based on local needs. However, there is no doubt that such large disparities among states prevent the benefits of early childhood education from reaching all children who could benefit. Given the increasing mobility of American society, the failings of one state to prepare children today is to the detriment of another state’s workforce down the line. We encourage all stakeholders in early childhood education to look at the data not just for their state, but for other states, and reach across state lines to bring best practices home and to their neighbors.
– Megan Carolan, Policy Research Coordinator, NIEER
About NIEER
The National Institute for Early Education Research (NIEER) at the Graduate School of Education, Rutgers University, New Brunswick, NJ, conducts and disseminates independent research and analysis to inform early childhood education policy.
