Executive Summary
The 21st State of Preschool finds the state of preschool in America at a critical moment. The states have emerged, albeit unevenly, from the worst of the COVID-19 pandemic, and are poised to make new progress toward more effective and equitable preschool policies. Additional states have committed to offering every child publicly funded preschool education and have begun working towards that goal. Enrollment in preschool increased in 2022-2023 and the percent of 3-year-olds and 4-year-olds enrolled in preschool reached all-time highs. But the number of children enrolled in state-funded preschool is still lower than it was prior to the pandemic, and six states are still without programs. All but a few states fall short of meeting at least one benchmark for policies regarding quality, and many fall short of meeting most of the benchmarks. Inadequate funding is a near universal problem. A key question for the future is whether or not states will increase funding enough to keep promises regarding program expansion and quality, including adequate pay for the workforce. Will this be the turning point needed for the country to make real progress towards high quality universal preschool?
Enrollment Increased to a Record High
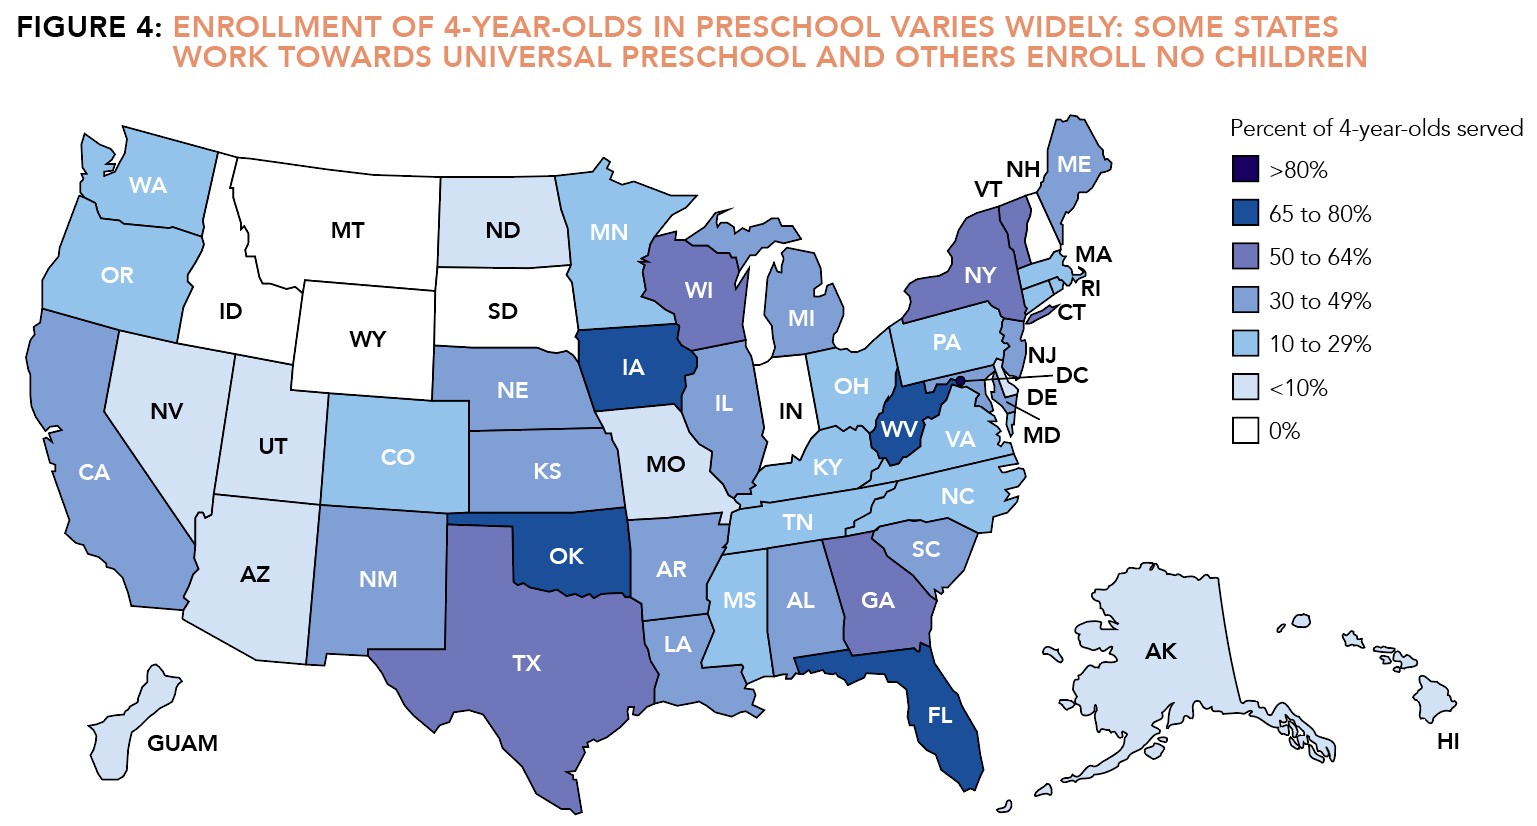
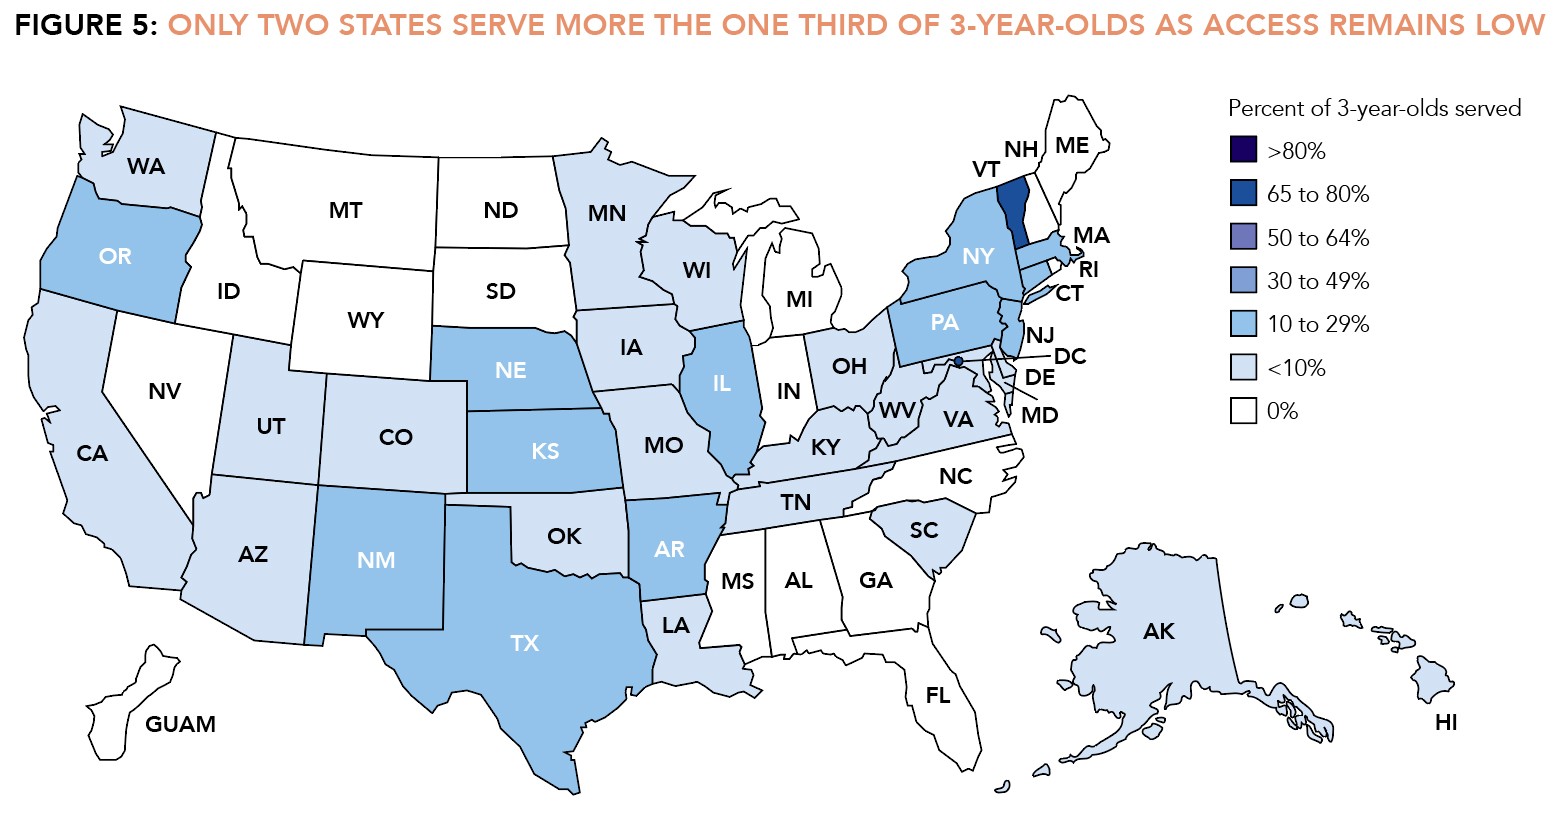
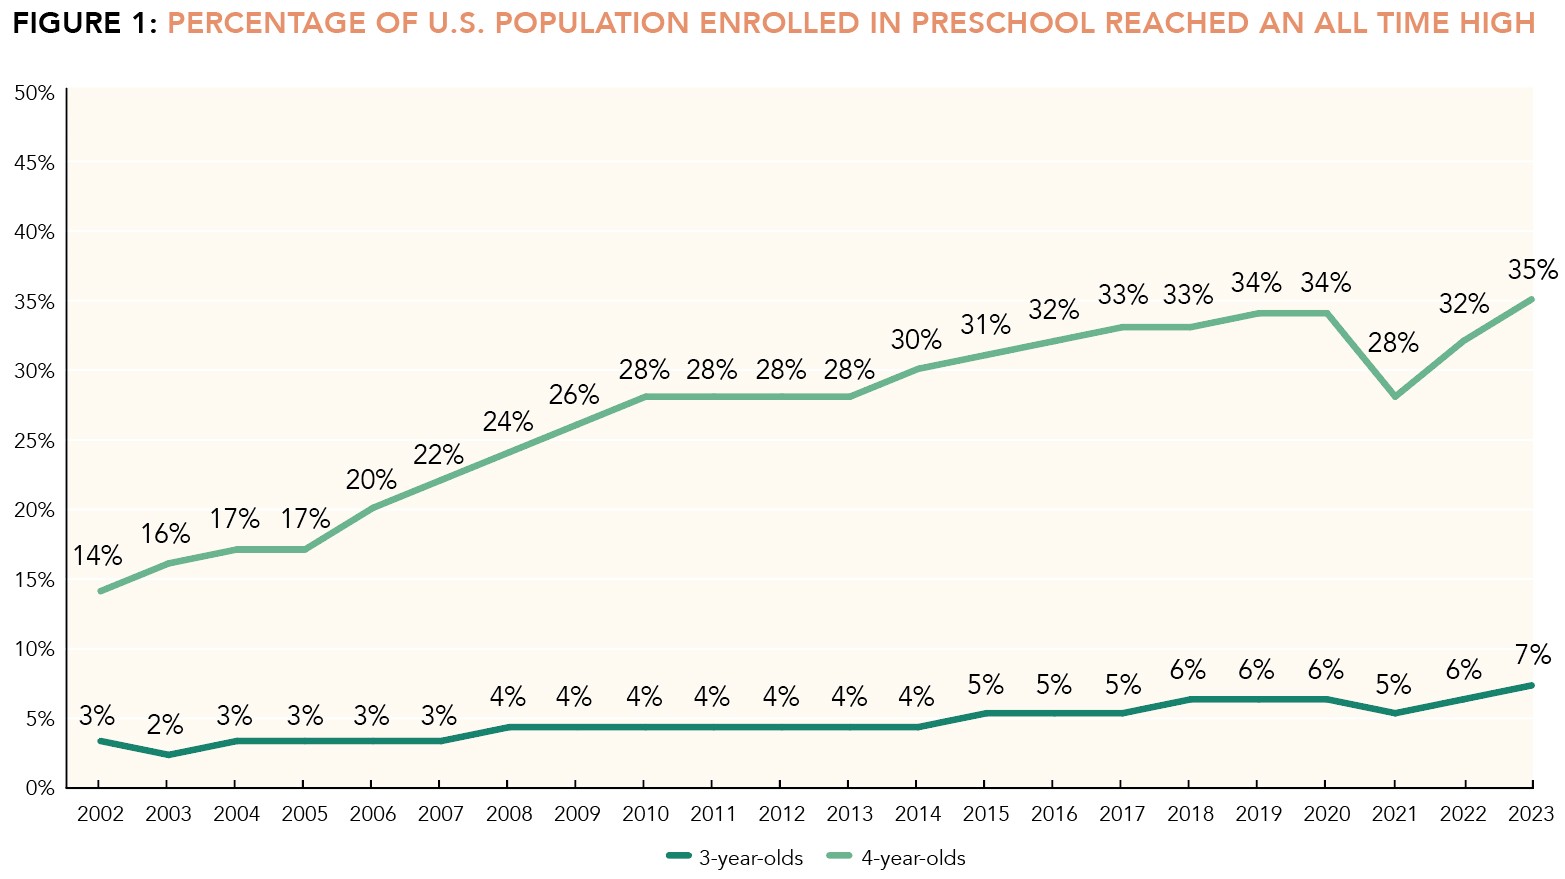
In the 2022-2023 school year, 1,631,968 children attended state-funded preschool, an increase of 110,209 children, up 7%, from the 2021-2022 school year. The number of children enrolled in preschool increased in all except six states. Enrollment of 3-year-olds increased (by 11%) to 7% of 3-year-olds and enrollment of 4-year-olds increased (by 6%) to 35% of 4-year-olds. New universal preschool initiatives in several states helped to push the nation to these record high percentages as shown in Figure 1.The declining population of young children also contributed to the boost in percentages, masking the fact that nearly 25,000 fewer children attended preschool in fall 2022 than in fall 2019 (prior to the pandemic). Less than half the states (only 17) enrolled more children in preschool in fall 2022 than in fall 2019. Although the percentage of 3- and 4-year-olds who attended state-funded preschool were at all-time highs in 2022-2023, and the number of 3-year-olds in state-funded preschool also hit an all-time high, the total number of children in state-funded preschool remained below pre-pandemic levels.
Preschool Spending Reached an All Time High
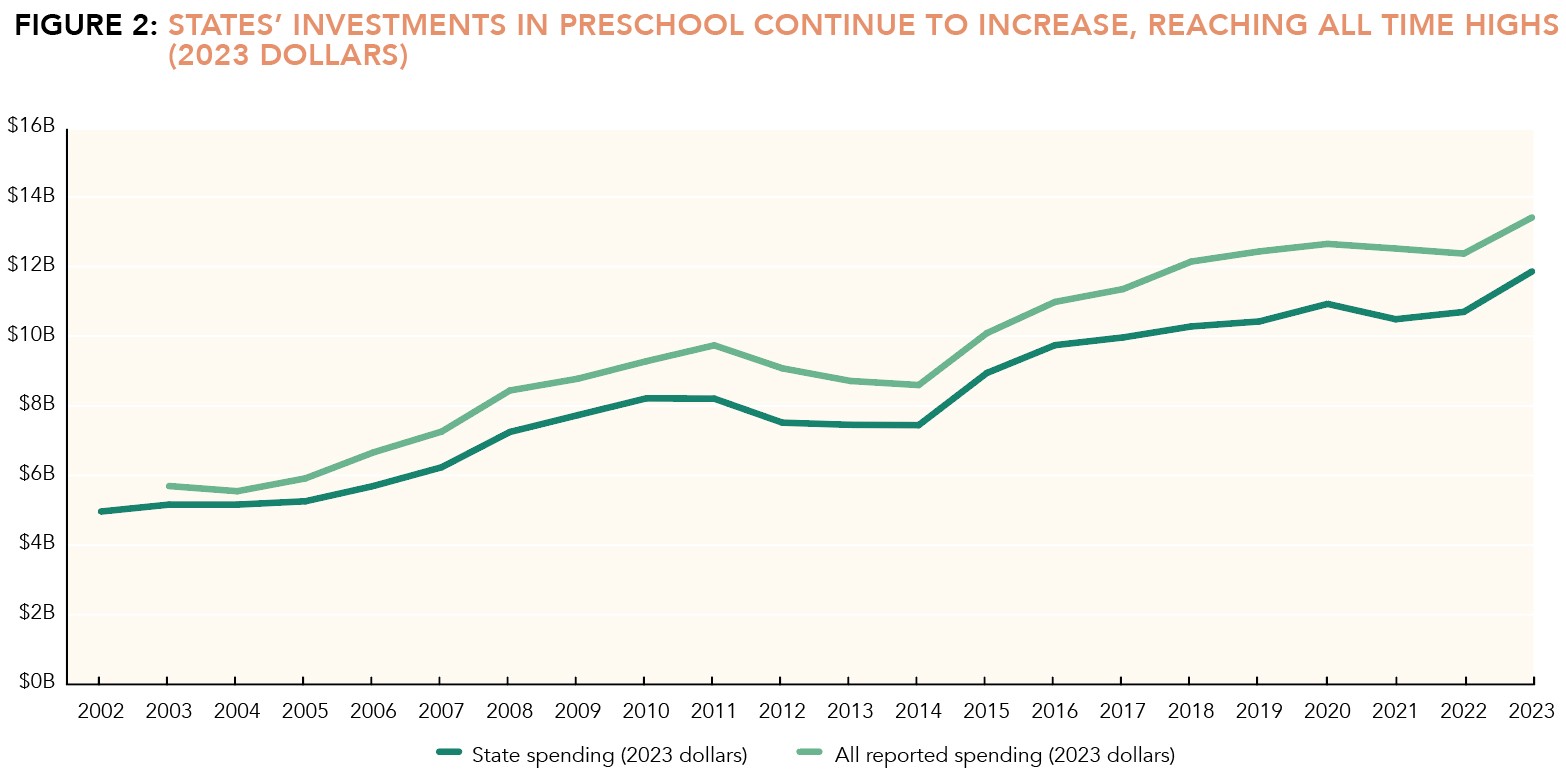
Perhaps the most notable finding for this year is that funding increased by a larger percentage than enrollment. States spent $11.73 billion (including COVID-19 relief dollars) on state-funded preschool in 2022-2023, an increase of $1.17 billion (11%) from 2021-2022 after adjusting for inflation. This is an all-time high (See Figure 2). Inflation-adjusted preschool spending increased in 29 states. Twenty-eight programs reported using federal COVID-19 relief funding to support preschool but many could not report the amount. Adding reported federal and local sources, known preschool spending topped $13.37 billion, also an all-time high, adjusting for inflation.
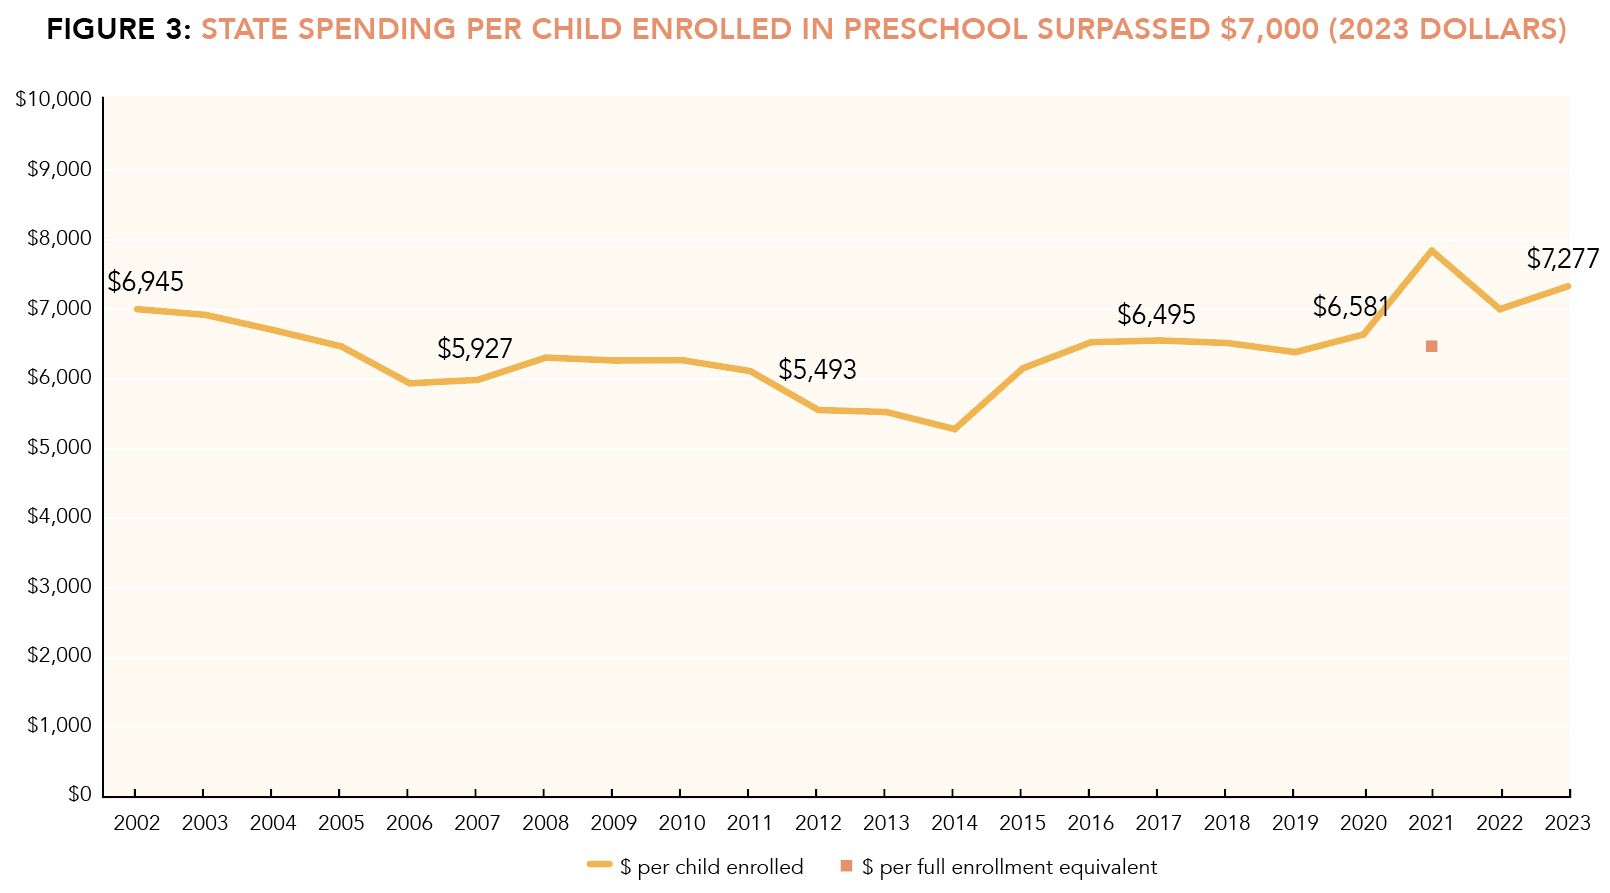
State spending per child averaged $7,277, surpassing the pre-pandemic high, but not substantially different from its level 21 years ago (See Figure 3). Including federal and reported local sources, spending per child exceeded $8,000. Adding in our estimates of unreported local funding, bumps this up to $11,300. However, even this figure falls far short of the cost of a high-quality full school day program. 1 As Table A shows, very few states fund preschool programs at levels that would cover this cost, and many are far, far below that mark.
Footnotes
- 1Rickus, G., Barnett, W. S., Nores, M., Weisenfeld, G., Friedman-Krauss, A., & Garver, K. (2019). Cost of Preschool Quality-Mini (CPQ-Mini). National Institute for Early Education Research
-
State Estimated per child cost of high-quality full-day preschool Gap between needed spending and current spending per child (including estimated local share)* Additional funding needed to provide a high-quality full-day program for 4-year-olds currently enrolled Additional funding needed to provide universal access to high-quality full-day preschool for 4-year-olds not currently enrolled Alabama $11,468 $587 $13,728,518 $319,590,224 Alaska $18,622 $12,118 $10,785,100 $121,749,357 Arizona $12,474 $7,061 $21,902,991 $800,866,092 Arkansas $12,547 Exceeds Minimum $0 $249,060,749 California $18,023 Exceeds Minimum $0 $4,027,882,307 Colorado $13,668 $7,210 $110,599,110 $506,639,481 Connecticut $18,437 $7,203 $50,535,304 $459,672,577 Delaware $14,983 $5,754 $4,022,168 $130,635,415 District of Columbia $18,061 Exceeds Minimum $0 $1,417,213 Florida $13,326 $9,155 $1,410,110,234 $481,983,967 Georgia $13,461 $5,080 $373,195,521 $558,146,906 Hawaii $15,043 $4,192 $2,423,185 $197,935,794 Idaho No Program $12,723 $0 $249,485,307 Illinois $14,133 $2,416 $117,171,853 $1,027,979,467 Indiana No Program $13,155 $0 $916,987,424 Iowa $13,524 $8,116 $208,596,420 $98,740,944 Kansas $12,814 $7,285 $118,968,855 $174,642,007 Kentucky $13,495 $1,005 $14,919,729 $387,831,858 Louisiana $12,809 $374 $6,850,100 $350,761,656 Maine $13,193 $2,289 $13,595,324 $68,844,215 Maryland $16,080 $1,325 $35,283,874 $584,717,039 Massachusetts $17,579 $13,541 $269,512,168 $692,137,968 Michigan $14,372 $2,518 $96,028,080 $830,874,064 Minnesota $14,724 $7,989 $58,988,732 $738,530,436 Mississippi $11,817 $3,244 $17,288,579 $231,742,095 Missouri $13,723 $300 $1,606,050 $767,239,208 Montana No Program $13,776 $0 $129,714,816 Nebraska $14,301 $2,667 $23,001,215 $194,093,709 Nevada $14,577 $4,680 $11,610,438 $428,971,718 New Hampshire No Program $14,439 $0 $158,410,269 New Jersey $16,448 $146 $5,160,711 $910,171,217 New Mexico $15,183 $6,242 $65,204,864 $124,288,505 New York $19,323 $113 $13,800,333 $1,238,318,253 North Carolina $12,097 $3,492 $89,677,704 $943,759,555 North Dakota $13,476 $5,943 $3,191,147 $103,320,769 Ohio $13,927 $7,984 $121,960,521 $1,332,660,702 Oklahoma $11,158 $112 $3,782,728 $86,293,516 Oregon $16,942 $810 $5,408,649 $483,649,953 Pennsylvania $14,271 $2,610 $89,096,450 $1,127,857,778 Rhode Island $16,036 $6,539 $15,457,266 $113,237,759 South Carolina $13,520 $7,171 $186,727,882 $325,277,679 South Dakota No Program $11,244 $0 $101,574,811 Tennessee $12,810 $3,408 $57,042,537 $670,248,689 Texas $14,495 $7,783 $1,576,189,832 $1,847,525,251 Utah $12,220 $7,403 $9,802,037 $476,372,398 Vermont $14,503 $4,864 $18,029,264 $15,895,288 Virginia $15,939 $2,892 $61,855,827 $1,028,703,062 Washington $16,441 $2,928 $40,961,064 $988,005,455 West Virginia $12,166 $1,720 $20,756,120 $43,778,868 Wisconsin $14,411 $7,458 $305,996,936 $186,871,601 Wyoming No Program $15,640 $0 $82,294,420 Total $5,680,825,422 $28,117,389,811 * NIEER estimated the likely local amount contributed to preschool in each state. For additional information, see the Methodology section for an explanation of the calculations.
Let's Not Forget Quality
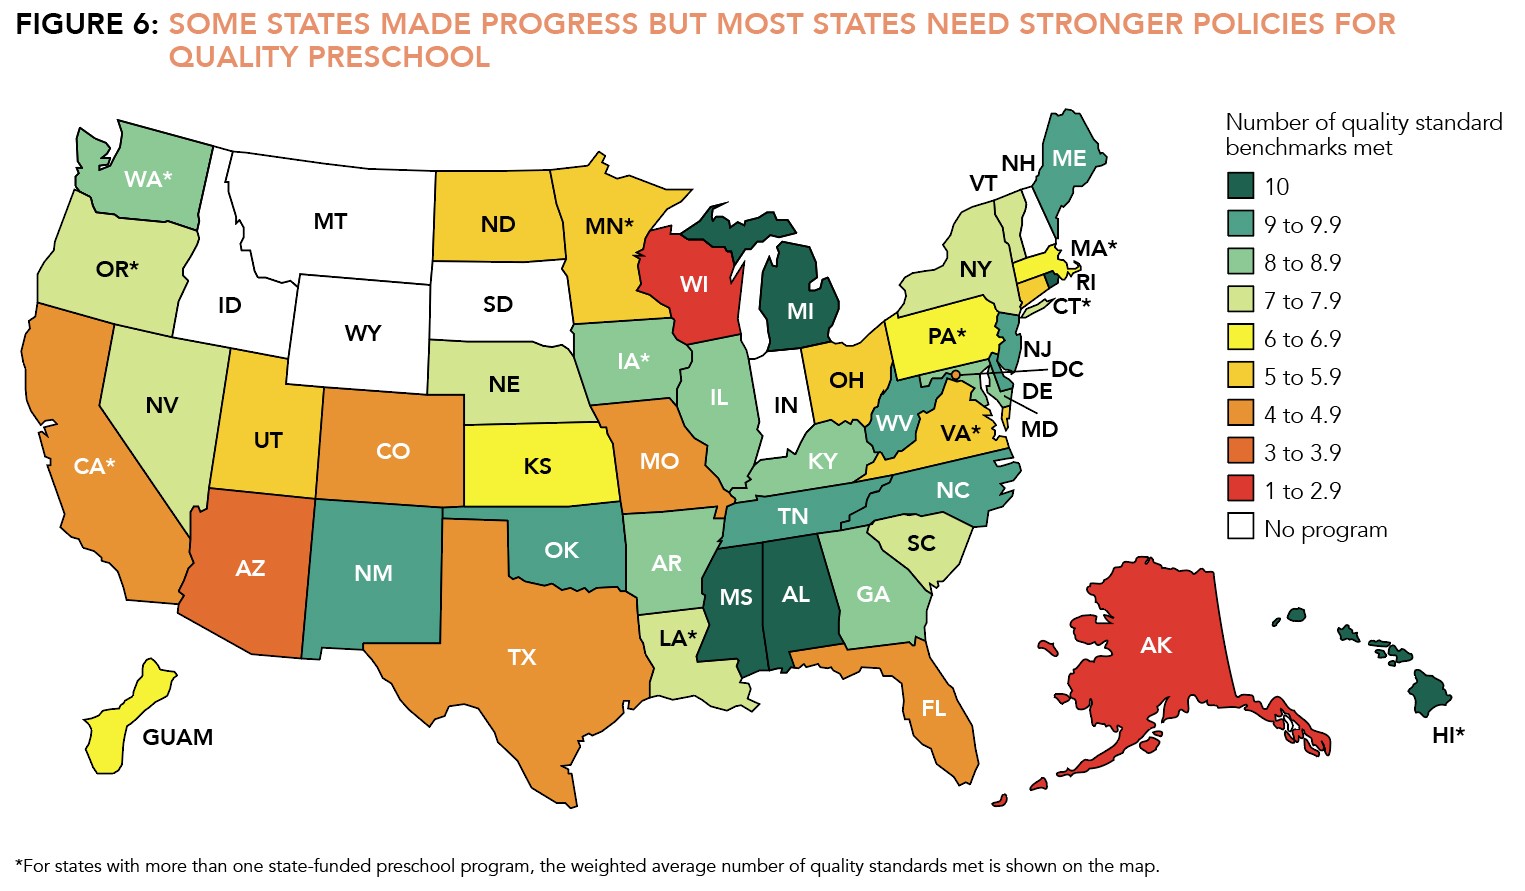
Once again, five states met all ten quality standards benchmarks but eight states met fewer than half (including the three states that serve the most children—California, Florida, and Texas). Nationally, young children are more than twice as likely to attend programs meeting fewer than half of NIEER’s quality standards benchmarks than programs meeting nine or ten. Inadequate funding is one reason, but not the only one, as some states choose to leave most standards up to local control and some benchmarked policies have modest costs.
Overall, states did make progress on policies to support quality, but a few states backtracked. A continuing concern is that even more states received an “*” for the lead teacher degree benchmark this year. These states have a policy that requires all lead preschool teachers to have at least a bachelor’s degree but, in practice, are allowing a large percentage of teachers to have a waiver to this requirement. Such policy waivers are a response—but not a solution—to the widely reported teacher shortage problem.
As in past years, the assistant teacher benchmark requiring that assistant teachers to hold a CDA or equivalent is one of the least met benchmarks—only 19 programs meet this benchmark. And most states that do not meet it, have no substantive requirements in place for assistant teachers. Given the importance of the teaching team for preschool quality, this lack of requirements is particularly concerning. Since policies setting low minimal qualifications tend to go with low pay, it is hardly surprising that turnover among assistant teachers is quite high.
A Time to Choose
As the challenges of the pandemic recede, federal, state, and local governments should renew their attention to how they can improve early education policies to provide more children—especially those most in need—with stronger early learning opportunities. Half of all 3- and 4-year-old children in poverty attend no preschool program at all. 2 States should lead the way, and the new wave of commitments to universal preschool education suggests they will do so. Yet, most states that have committed to serve all children still have far to go to meet the call, and most states have not yet made this commitment. In addition, as states expand enrollment, they face crucial choices about quality and adequate funding. Once program enrollment becomes quite large, the total cost of raising quality and increasing funding per child becomes similarly large. By contrast, if a program starts with high standards and adequate funding per child with a modest enrollment, that program can gradually be expanded to more children in small bites of the budget. Of course, that risks stalling out on the path to universal access, but universal access to low-quality publicly funding programs may do more harm than good. 3 Local governments also can choose to move forward to expand access, increase quality, and raise funding if their states do not. Finally, the federal government could play a much larger role than it does now. Below we highlight seven major policy issues for states to consider as they make choices that will determine the future of early education.
- Preschool funding: How much of an investment will states make given their current (and future) fiscal environment, will this funding provide an adequate per child amount to support a quality program and with adequate teacher compensation, and what methods will they use to fund preschool? California added nearly $1 billion in preschool funding in 2022-2023 on road to universal preschool for 4-year-olds and New Jersey added $60 million to support universal preschool for 3- and 4-year-olds. Both states are committed to expanding preschool access but face uncertainties in their fiscal environments.
- Universal access: Will states commit to preschool for all, and, if so, for whom? Will they prioritize access for children in the lowest income families who are least able to purchase quality preschool education on their own? Will they include only 4-year-olds, or also include 3-year-olds? Will they commit to a timeline for achieving universal access? Georgia, Illinois, Maine, and New York have universal policies that they have not fully implemented. These states all increased enrollment last year. California, Colorado, Hawaii, and New Mexico have recently passed laws to provide universal preschool. If state budgets tighten, will they continue to expand their enrollment? Governors in Illinois, Michigan, and New Jersey also announced support for universal preschool (for 3- and 4-year-olds in Illinois and New Jersey). Even in states without universal preschool, do they have plans to expand? Some states like Alabama, Mississippi, and Rhode Island have been committed to expanding access while maintaining high standards for quality.
- Access for 3-year-olds: Two years of high quality preschool can have much larger impacts than one year. 4 Will states make larger investments in serving 3-year-olds? Only DC and Vermont offer universal preschool beginning at age 3. Illinois and New Jersey offer pre-K beginning at age 3, but remain far from offering universal access. Some states have gradually expanded access, for example, Connecticut, Massachusetts, New Mexico, Oklahoma, Tennessee, and Texas. However, many states, including some that offer universal preschool at age 4, serve virtually no 3-year-olds outside of preschool special education.
- Mixed delivery: How will states provide preschool, particularly those states working to expand access? More than 60% of children in state-funded preschool programs were served in public schools in 2022-2023. Will states support mixed-delivery, public-private partnerships for preschool? If so, will this be done in a way that ensures uniform quality— including supports for the workforce—across settings? New Jersey, New Mexico and West Virginia are three states with strong mixed delivery systems for preschool, and they provide three very different models for accomplishing this goal. There can be many benefits of mixed delivery including using existing space designed for children, an experienced workforce, and access to before and after care. 5 However, too many states have created two-tier systems where funding and standards are lower in private settings. Inequalities can be eliminated by establishing and funding the same standards for all settings.
- Length of day: Will states provide at least a full school-day option for all families who want it? School-day programs can have added child development benefits, and especially when coupled with before and after care (e.g., extended day) also better support working parents.
6
Nationally, there has been a shift to serve more children in at least school-day (compared to part-day) preschool programs. In 2010, 40% of children in state-funded preschool attended at least a school-day program. By 2023, this increased to 72%.
States vary greatly in the percentage of children served for a full school day. Alabama, Arkansas, DC, Georgia, Hawaii, Louisiana, Nevada, North Carolina, Rhode Island, and Tennessee provide at least 6 hours of preschool per day to all children enrolled. Other states provide as little as 10 hours per week of preschool. School-day preschool with the option for wrap around care before and after the school day can meet both the educational and developmental needs of children and the child care needs of families. - Quality: Will states commit to high quality preschool? What new policies will states enact to improve quality? Alabama, Mississippi, and Rhode Island are examples of states that have remained committed to high quality preschool while expanding access. These states started small and have gradually increased the number of children served each year while meeting all ten of NIEER’s quality standards benchmarks. Other states serve a high percentage of children but meet few quality standards benchmarks. As the new group of states works towards universal preschool, it remains to be seen which path they will follow. Hawaii currently meets all ten benchmarks but has a long way to go to reach universal access. Colorado began its new universal preschool program without establishing all of the program standards for quality. New Jersey increased standards around professional development plans for assistant teachers and now meets a ninth benchmark as the program continues to expand. California is reducing class size and developing new standards for serving preschoolers with disabilities and Dual Language Learners in Transitional Kindergarten.
- Workforce: It is a particularly critical time for the early childhood workforce and the workforce is a central part of preschool quality. Forty-seven programs reported a shortage of preschool teachers. More states reported employing teachers with waivers to the education and specialized training requirements. How will states recruit, support, and retain a qualified workforce? Will states develop policies for compensation parity in mixed delivery systems and with K–12? What policies will states put in place to help those who want to be assistant teachers and teachers become fully qualified? Many states have in place or are developing systems to support teachers in attaining a degree and/ or license through a non-traditional pathway, but the extent of these programs varies widely. Twenty-seven states reported having a program to support lead preschool teachers to earn a degree or credential through non-traditional routes; 10 states reported having such a program that is under development. Will states develop policies for compensation parity in mixed delivery systems and with K–12? Twenty-eight states have at least some requirements for salary parity with K–12 for lead preschool teachers in public schools—but this leaves out many teachers. Among the states currently working towards universal preschool, California TK, Hawaii, and New Jersey have parity policies in place for all lead teachers; New Mexico requires parity only for lead teachers in public schools but not those in mixed-delivery settings.
Footnotes
- 2U.S. Census Bureau, Current Population Survey, School Enrollment Supplement, October 2022.
- 3Baker, M., Gruber, J., & Milligan, K. (2019). The long-run impacts of a universal child care program. American Economic Journal: Economic Policy, 11(3), 1-26.
- 4Barnett, W. S. & Jung, K, (2021). Effects of New Jersey’s Abbott preschool program on children’s achievement, grade retention, and special education through tenth grade. Early Childhood Research Quarterly, 56, 248-259.
- 5Weiland, C., McCormick, M., Duer, J., Friedman-Krauss, A. H., Pralica, M., Xia, S., Nores, M., & Mattera, S. (2022). Mixed-delivery public prekindergarten: Differences in demographics, quality, and children’s gains in community-based versus public preschool across five large-scale systems. (EdWorkingPaper: 22-651). Annenberg Institute at Brown University: https://doi.org/10.26300/pncz-2233; Weiland, C., McCormick, M., & Friedman-Krauss, A. H. Equity in mixed-delivery prekindergarten systems required new investments and new thinking. Brookings Brown Center Chalkboard. December 6, 2022.
- 6Atteberry, A., Bassok, D., & Wong, V. (2019). The effects of full-day prekindergarten: Experimental evidence of impacts on children’s school readiness. Educational Evaluation and Policy Analysis, 41, 537-562; Reynolds, A. J., Richardson, B. A., Hayakawa, M., Lease, E. M., Warner-Richter, M., Englund, M. M., Ou, S. R., & Sullivan, M. (2014). Associations of a full-day vs part-day preschool intervention with school readiness, attendance, and parent involvement. Journal of the American Medical Association, 312, 2126-2134.
Conclusion
State-funded preschool education has grown substantially over the past 20 plus years and has emerged from the pandemic stronger than ever. Primarily this has been a story of quantitative growth. Enrollment and spending (inflation-adjusted) have more than doubled over the last 20 years. More programs offer full school day preschool. Quality standards have been slower to improve but some progress has been made. A handful of states meet all the minimum benchmarks we set for program quality standards. None did in 2002. The average number of benchmarks states meet has increased by about one benchmark.
Nevertheless, our nation has far to go before every child has access to high quality preschool and no prospect of achieving this goal in our lifetimes without accelerated change. Early education opportunity in the United States still depends on your zip code. Access to public preschool and the quality of those offerings varies greatly across and within states. Perhaps the most remarkable finding in our report is that real spending per child on state pre-K has not improved in two decades. That lack of progress is hard to comprehend considering that both K–12 spending per pupil and GDP per capita increased by nearly 30 percent over the same period. 7 In a very meaningful sense, investment in early education quality—the features of programs that benefit child development—has not kept pace. It should not be surprising then if research finds few state pre-K programs deliver the promised benefits for long-term educational success. 8
Internationally, the United States falls further behind other countries with every passing year. 9 We no longer lag just the developed European countries, Australia, Japan, Korea, and New Zealand, we have fallen behind Mexico, Colombia, and Brazil. The uptick in state commitments to universal preschool, at least at age 4, promises some catch up to the rest of the world. However, unless expanded enrollment is accompanied by an unprecedented commitment to quality and increased funding per child, increased enrollment is unlikely to improve learning and development for many children.
Whether to commit to (and adequately fund) quality public early education may be the most important choice that states— but also cities and the federal government—face today and over the next several years. We recognize the role of cities because in many states where quality has lagged, cities have stepped up to raise standards and provide additional funding. The federal government could play a much larger role than it currently does, going beyond Head Start (which serves fewer 3- and 4-year-olds with each passing year) to provide funding that supports and incentivizes higher quality in state preschool programs. Even a modest federal investment could dramatically change the funding available for quality. In a $28 trillion dollar economy, both the amounts spent on preschool and the increases needed to pay for quality are miniscule.
We calculate that another $30 billion would be needed to raise quality and increase access to serve 90 percent of all 4-year-olds with a full school-day of public preschool (See Table A). 10 As this is more than double current annual preschool spending, it is highly unlikely that this increase will occur without some dramatic shift in public policy. What might make it happen? One approach would be for the federal government to offer states matching funds to increase their investments. If the federal government offered to match increased state funding dollar for dollar, this goal could be reached with 10 percent growth in spending per year for 10 years starting at $1.5 billion in federal spending and ending at $15 billion (in today’s dollars) in federal spending annually.
In presidential election years such as 2024, our nation becomes more focused on public policy choices. For early childhood education, the choices are clear. Should every child have equal access to a good publicly funded preschool education or should a child’s first educational experiences depend on their zip code? Should the federal government take some responsibility for supporting minimum levels of preschool quality across states by offering matching funds or should it ignore the growing inequalities between states? Should the United States return to first place internationally for investing in education, or should we fall further behind? It should be no surprise that nations surpassing us in higher education also surpass us in early childhood education. There is a causal connection. Perhaps the question that most needs to be asked is this: Do we value everything in our current spending more than improvements in the education of our young children? If not, our elected officials need to set new priorities. Every candidate this year should be asked about theirs.
Footnotes
- 7U.S. Bureau of Economic Analysis, Real gross domestic product per capita [A939RX0Q048SBEA], retrieved from FRED, Federal Reserve Bank of St. Louis; https://fred.stlouisfed.org/series/A939RX0Q048SBEA, March 22, 2024. National Center for Education Statistics (2023). Digest of Education Statistics. Table 236.55. Total and current expenditures per pupil in public
elementary and secondary schools: Selected school years, 1919-20 through 2020-21 - 8Bartik, Timothy J., and Brad Hershbein. 2018. “Pre-K Effectiveness at a Large Scale.” Employment Research 25(2): 5-7. https://doi.org/10.17848/1075-8445.25(2)-2
- 9OECD (2017). Starting Strong 2017: Key OECD Indicators on Early Childhood Education and Care, OECD Publishing, Paris.
- 10Rickus et al. (2019).
What's New?
-
- Total state spending for preschool programs reached $11.16 billion across 44 states and the District of Columbia*, with six states still not funding preschool in 2022-2023. States reported spending an additional $571 million in federal COVID-19 relief funding.
- Including COVID-19 relief dollars, spending on state-funded preschool increased by nearly $1.17 billion (11%), adjusted for inflation, from 2021-2022 to 2022-2023.
- Average state funding per child enrolled (including COVID-19 relief) was $7,277 in 2022-2023, Adjusted for inflation this is a $333 per child increase from 2021-2022.
- All-reported spending, which includes local and federal dollars, to the extent states can report them, was $13.37 billion, an inflation-adjusted increase of more than $1 billion (8%) from 2021-2022. All-reported spending per child was $8,294, an inflation-adjusted increase of $102 from 2021-2022. When we add to this calculation our estimate of local matching funds that goes unreported, the estimated total is $11,300.
-
- States enrolled more than 1.63 million children in state-funded preschool in 2022-2023, including 1.33 million four-year-olds and 273,416 three-year-olds. States served 7% of 3-year-olds and 35% of 4-year-olds, all-time highs in the percentages served.
- Enrollment in state-funded preschool increased by 110,209, or 7% since 2021-2022. The total number of children enrolled in preschool increased in all but six states.
- Preschool enrollment was still down nationally by 1.5% from the pre-pandemic level of 2019-2020. The number of children enrolled in preschool was still below pre-pandemic levels in 28 states.
- DC and nine states enrolled more than 50% of 4-year-olds in state-funded preschool. Only DC served more than 70% of 4-year-olds (88%). Only DC (79%) and Vermont (71%) served more than one-third of 3-year-olds.
- Across all major public programs – state-funded preschool, preschool special education, and Head Start – 44% of 4-year-olds and 17% of 3-year-olds were served.
-
- Alabama, Hawaii, Michigan, Mississippi, and Rhode Island continue to be the only five states to meet all 10 of NIEER’s benchmarks for state preschool quality standards.
- Five programs gained new quality standards benchmarks from policy changes.
- Florida began requiring annual structured classroom observations in all classrooms and now meets the continuous quality improvement system benchmark.
- New Jersey instituted a new policy requiring all assistant teachers to have annual professional development plans and now meets the staff professional development benchmark.
- North Carolina now requires all assistant teachers to have at least a CDA, meeting the assistant teacher benchmark.
- Oregon Pre-K and Oregon Preschool Promise began a new system for structured classroom observation and both programs now meet the continuous quality improvement system benchmark.
- Eleven state-funded preschool programs met fewer than half of the quality standards benchmarks, including three of the five largest programs. Thirty-seven percent of children in state-funded preschool were in a program meeting fewer than half of the quality standards benchmarks. Only 16% were in programs meeting nine or ten benchmarks—this is an increase from 11% last year. More than twice as many children were enrolled in programs meeting fewer than half of the benchmarks than were in programs that met nine or ten.
- NIEER’s benchmarks are for policies regarding quality standards rather than implementation. However, at some point waivers or “exceptions” to policies—official or unofficial—become so extensive that the de facto policy is different and should be rated accordingly. During the pandemic, waivers to policies became much more extensive and some have continued even as the emergency has passed. As it is unclear yet whether these will be reversed, this year programs received an “*” for standards that were known to not be fully implemented. Seven programs received an “*” for the lead teacher degree benchmark. Two programs received an “*” for the continuous quality improvement benchmark.
-
- More states that ever have or are working towards universal preschool with some focused on 4-year-olds only and others striving to serve all 3- and 4-year-olds. These states include some of the most populous, and if they achieve universal access it would dramatically shift the preschool landscape nationally.
- Six states (Florida, Iowa, Oklahoma, Vermont. West Virginia, and Wisconsin) and the District of Columbia can be said to have already implemented universal preschool for 4-year-olds. The District of Columbia and Vermont also provide universal access for 3-year-olds.
- Four states (Georgia, Illinois, Maine, and New York) have policies for universal preschool that have not been fully implement though all four states enrolled more children in 2022-2023 than in the prior year.
- California, Colorado, Hawaii, and New Mexico have passed laws for universal preschool in recent years.
- Michigan and New Jersey have support from their governors for universal preschool and are working to expand access.
- Twenty-nine programs reported providing a list of state approved or state recommend preschool curricula. And 19 programs require that all preschool programs and sites adopt a curriculum from that list.
- The most common reasons for selecting curricula for the approved or recommended list include alignment with the Early Learning and Development Standards and research on curriculum effectiveness.
- Most programs had a more than one person or group involved in the decision making around selecting curricula for the approved/recommended list including a state curriculum review committee, state pre-K administrators, an curriculum specialist employed by the state.
- Coaching and professional development around curriculum implementation was most commonly provided by coaches and mentors, curriculum specialists employed by the curriculum company, QRIS specialists, child care resource and referral agencies, child care center directors, Head Start directors, and school principals.
- More states that ever have or are working towards universal preschool with some focused on 4-year-olds only and others striving to serve all 3- and 4-year-olds. These states include some of the most populous, and if they achieve universal access it would dramatically shift the preschool landscape nationally.