National Access
| Total state pre-K enrollment, all ages | 1,526,116 |
| State-funded preschool programs | 62 programs in 44 states and DC *1 |
| Income requirement | 35 state programs have an income requirement |
| Minimum hours of operation | 26 part-day; 14 school-day; 6 extended-day; 16 determined locally *2 |
| Operating schedule | 1 full calendar year; 42 school/academic year; 19 determined locally |
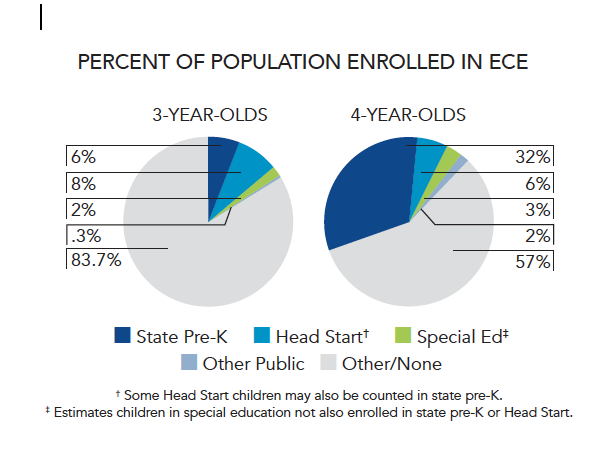
| Special education enrollment, ages 3 and 4 | 409,619 |
| Federally funded Head Start enrollment, ages 3 and 4 | 612,725 *3 |
| State-funded Head Start enrollment, ages 3 and 4 | 15,433 *4 |
|
| † Some Head Start children may also be counted in state pre-K. ‡ Estimates children in special education not also enrolled in state pre-K or Head Start |
National Quality Standards Checklist Summary
| POLICY | BENCHMARK | OF THE 62 STATE-FUNDED PRE-K INITIATIVES, NUMBER MEETING THE BENCHMARK |
| Early learning & development standards | Comprehensive, aligned, supported, culturally sensitive | 60 |
| Curriculum supports | Approval process & supports | 56 |
| Teacher degree | BA | 33 |
| Teacher specialized training | Specializing in pre-K | 50 |
| Assistant teacher degree | CDA or equivalent | 19 |
| Staff professional development | For teachers & assistants: At least 15 hours/year; Individual PD plans; Coaching | 18 |
| Maximum class size | 20 or lower | 47 |
| Staff-child ratio | 1:10 or better | 50 |
| Screening & referral | Vision, hearing & health screenings; & referral | 43 |
| Continuous quality improvement system | Structured classroom observations; Data used for program improvement | 41 |
For more information about the benchmarks, see the Executive Summary and Roadmap to State Profile Pages.
National Resources
| Total state pre-K spending | $9,902,706,335 |
| Local match required? | 13 |
| State Head Start spending | $285,269,074 5 |
| State spending per child enrolled | $6,571 6 |
| All reported spending per child enrolled* | $7,656 |
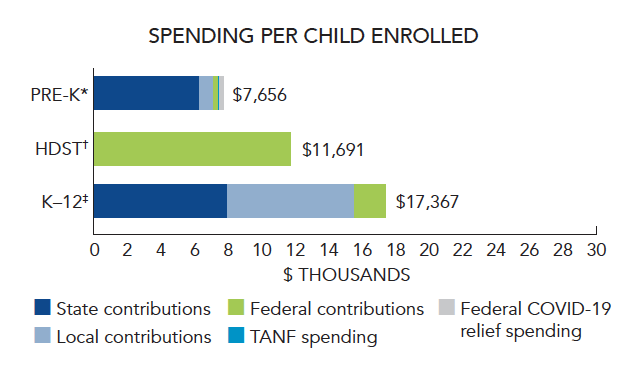
| * Pre-K programs may receive additional funds from federal or local sources that are not included in this figure. † Head Start per-child spending includes funding only for 3- and 4-year-olds. ‡ K–12 expenditures include capital spending as well as current operating expenditures. |
- Throughout this report, the District of Columbia is included like a state, resulting in a list of 45 states for rankings. In 2015-2016, Guam began offering a “state”-funded pre-K program but is not included in totals or rankings in this report.
- NIEER’s definitions of hours of operation are as follows: part-day programs serve children for fewer than 4 hours per day; school-day programs serve children at least 4 hours per day but fewer than 6.5 hours per day; and extended-day programs serve children for 6.5 or more hours per day. Some programs offer multiple hours of operation but only the minimum one is listed here.
- The enrollment figures for federal Head Start include funded children in the program in all 50 states, D.C., and the U.S. territories, as well as funded enrollment in the Migrant & Seasonal and American Indiana/Native Alaskan programs. These numbers do not include children funded by state match.
- This figure is based on the Head Start enrollment supported by state match as reported by ACF and additional information from surveys of state supplemental Head Start programs. This figure includes 12,735 children who attended programs that were considered to be state-funded preschool programs and are also included in the state-funded preschool enrollment total.
- This figure includes $170,713,936 also included in the total state pre-K spending. This also includes some funding for state supplements to Early Head Start where states could not separate Head Start and Early Head Start funding.
- This figure includes federal TANF funds and federal COVID-19 relief funds directed toward preschool at states’ discretion.
Data are for the 2021-2022 school year, unless otherwise noted.