State of Preschool
Kansas
Access Rankings
Resource Rankings
Total Benchmarks Met


Overview
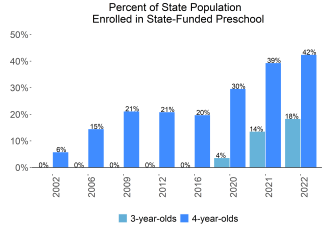
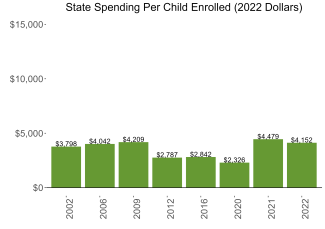
During the 2021-2022 school year, Kansas preschool enrolled 22,579 children, an increase of 2,431 from the prior year, as the program began to recover from the impact of the COVID-19 pandemic. State spending totaled $89,616,097, and an additional $4,132,317 in TANF funds supports the program, up $3,499,287 (4%), adjusted for inflation since last year. State spending per child equaled $4,152 in 2021-2022, down $327 from 2020-2021, adjusted for inflation. Kansas met 6 of 10 quality standards benchmarks.
What's New
During the 2021-2022 school year, the Kansas State Board of Education (KSBE) extended a time of emergency to allow anyone with a five-year substitute or an emergency substitute teaching license, or certificate with a baccalaureate degree to teach.
Kansas is also now using Medicaid eligibility data to qualify children for free- or reduced-price school meals. As children who qualify for free meals also qualify as preschool-aged at-risk, the state anticipates that this will lead to an increase in preschool-aged at-risk enrollment.
In December 2022, Kansas was awarded a federal Preschool Development Grant Birth through Five (PDG B–5) planning grant for $4 million. With these funds, the state will conduct a statewide comprehensive needs assessment to inform a five-year All in for Kansas Kids strategic plan.
Background
Kansas supports two state-funded prekindergarten programs. The first, established in 1998, is the State Pre-K 4 Year Old At-Risk Program (more recently renamed the Preschool-Aged At-Risk Program). The second is the Kansas Preschool Pilot (KPP), first offered in the 2006-2007 school year. Both programs are operated by the Kansas Department of Education (KSDE) and are reported together due to their similar standards and overlapping enrollment.
The Kansas Preschool-Aged At-Risk Program was available in 255 out of 286 school districts during the 2021-2022 school year, and KPP was available in 127 out of 286 school districts. Both programs are permitted to serve certain 3-year-olds, who are reported for the first time in 2021-2022.
In 2015, KSBE announced a new vision for education in the state: Kansas leads the world in the success of each student. Kindergarten Readiness is one identified metric to track progress toward this goal. In 2018, the KSDE was internally restructured to increase emphasis and capacity around early childhood. Beginning in 2020, the Kansans Can Star Recognition Program gives districts the opportunity to apply for recognition in the qualitative Board Outcome areas, including Kindergarten Readiness. This will provide an opportunity to measure and drive quality improvements at the community level.
Preschool Offered by Public School Districts
Access
Resources
| Total state pre-K spending | $93,748,414 |
| Local match required? | No |
| State Head Start spending | $0 |
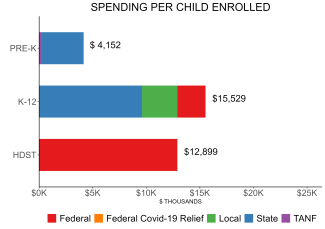
| State spending per child enrolled | $4,152 |
| All reported spending per child enrolled* | $4,152 |

Pre-K programs may receive additional funds from federal or local sources that are not included in this figure. K–12 expenditures include capital spending as well as current operating expenditures. Head Start per-child spending includes funding only for 3- and 4-year-olds.
Kansas Quality Standards Checklist
| Policy | Requirement | Benchmark | Meets Benchmark? |
|---|---|---|---|
For more information about the benchmarks, see the Executive Summary and the Roadmap to State pages. | 6benchmarks met | ||
| Early Learning & Development Standards Benchmark | Comprehensive, aligned, supported, culturally sensitive | Comprehensive, aligned, supported, culturally sensitive | |
| Curriculum Supports Benchmark | Approval process & supports | Approval process & supports | |
| Teacher Degree Benchmark | BA | BA | |
| Teacher Specialized Training Benchmark | ECE, CD, Elem. Ed. | Specializing in pre-K | |
| Assistant Teacher Degree Benchmark | Other | CDA or equivalent | |
| Staff Professional Development Benchmark | 15 hours/year; PD plans (teachers only); Coaching (some teachers) | For teachers & assistants: At least 15 hours/year; individual PD plans; coaching | |
| Maximum Class Size Benchmark | 20 (3- & 4-year-olds) | 20 or lower | |
| Staff to Child Ratio Benchmark | 1:10 (3- & 4-year-olds) | 1:10 or better | |
| Screening & Referral Benchmark | Vision, hearing, developmental | Vision, hearing & health screenings; & referral | |
| Continuous Quality Improvement System Benchmark | None | Structured classroom observations; data used for program improvement | |

