State of Preschool
Virginia
Access Rankings
4-year-Olds
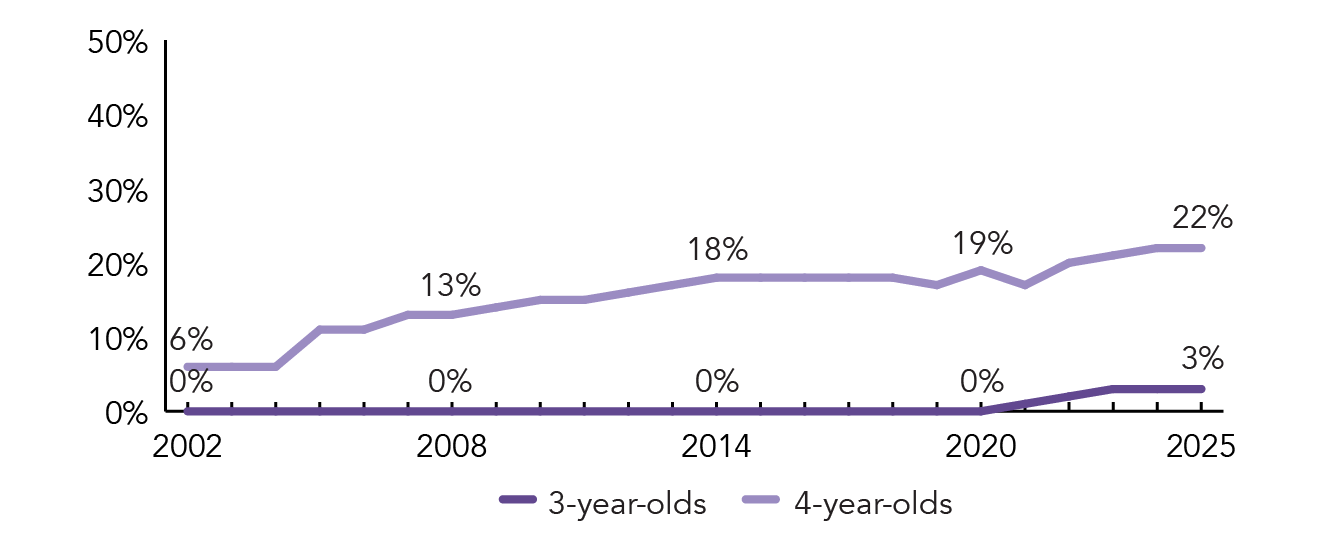
31
3-year-Olds
26
Resource Rankings
State spending
28
All reported spending
18
Total Benchmarks Met
Of 10 benchmarks possible
5
Overview
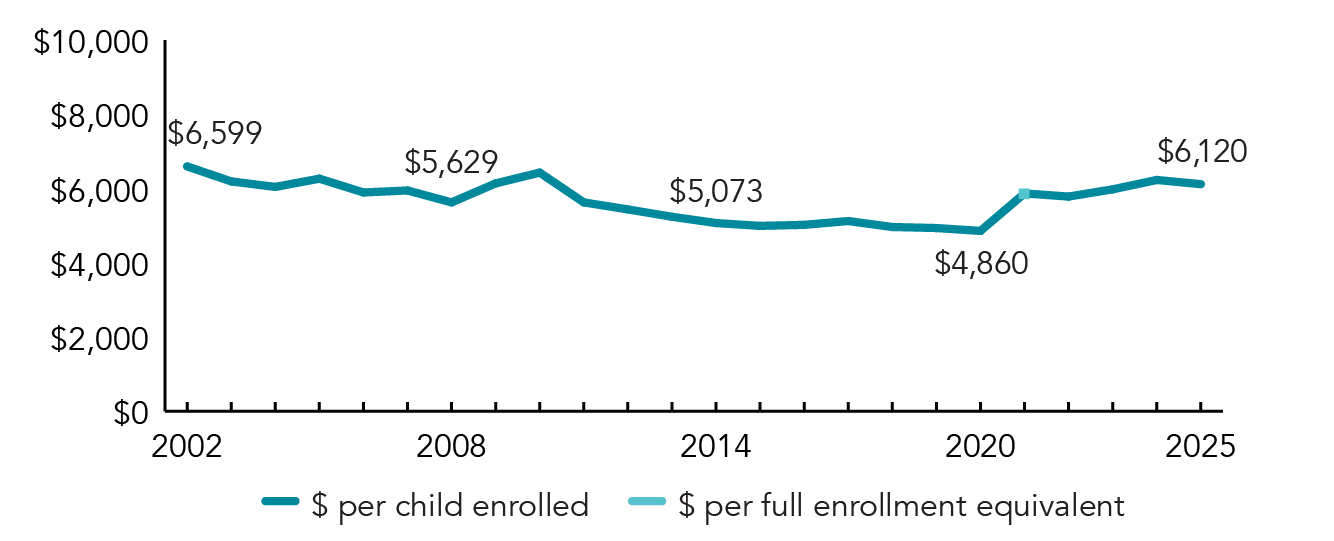
During the 2024-2025 school year, Virginia Preschool Initiative (VPI) enrolled a total of 24,425 children, an increase in VPI enrollment of 1,387 from the prior year. VPI spending totaled $149,480,336, up $25,391,932 (20%), adjusted for inflation, since last year. State spending per child equaled $6,120 in 2024-2025, up $734 from 2023-2024, adjusted for inflation. VPI met 5 of 10 quality standards benchmarks.
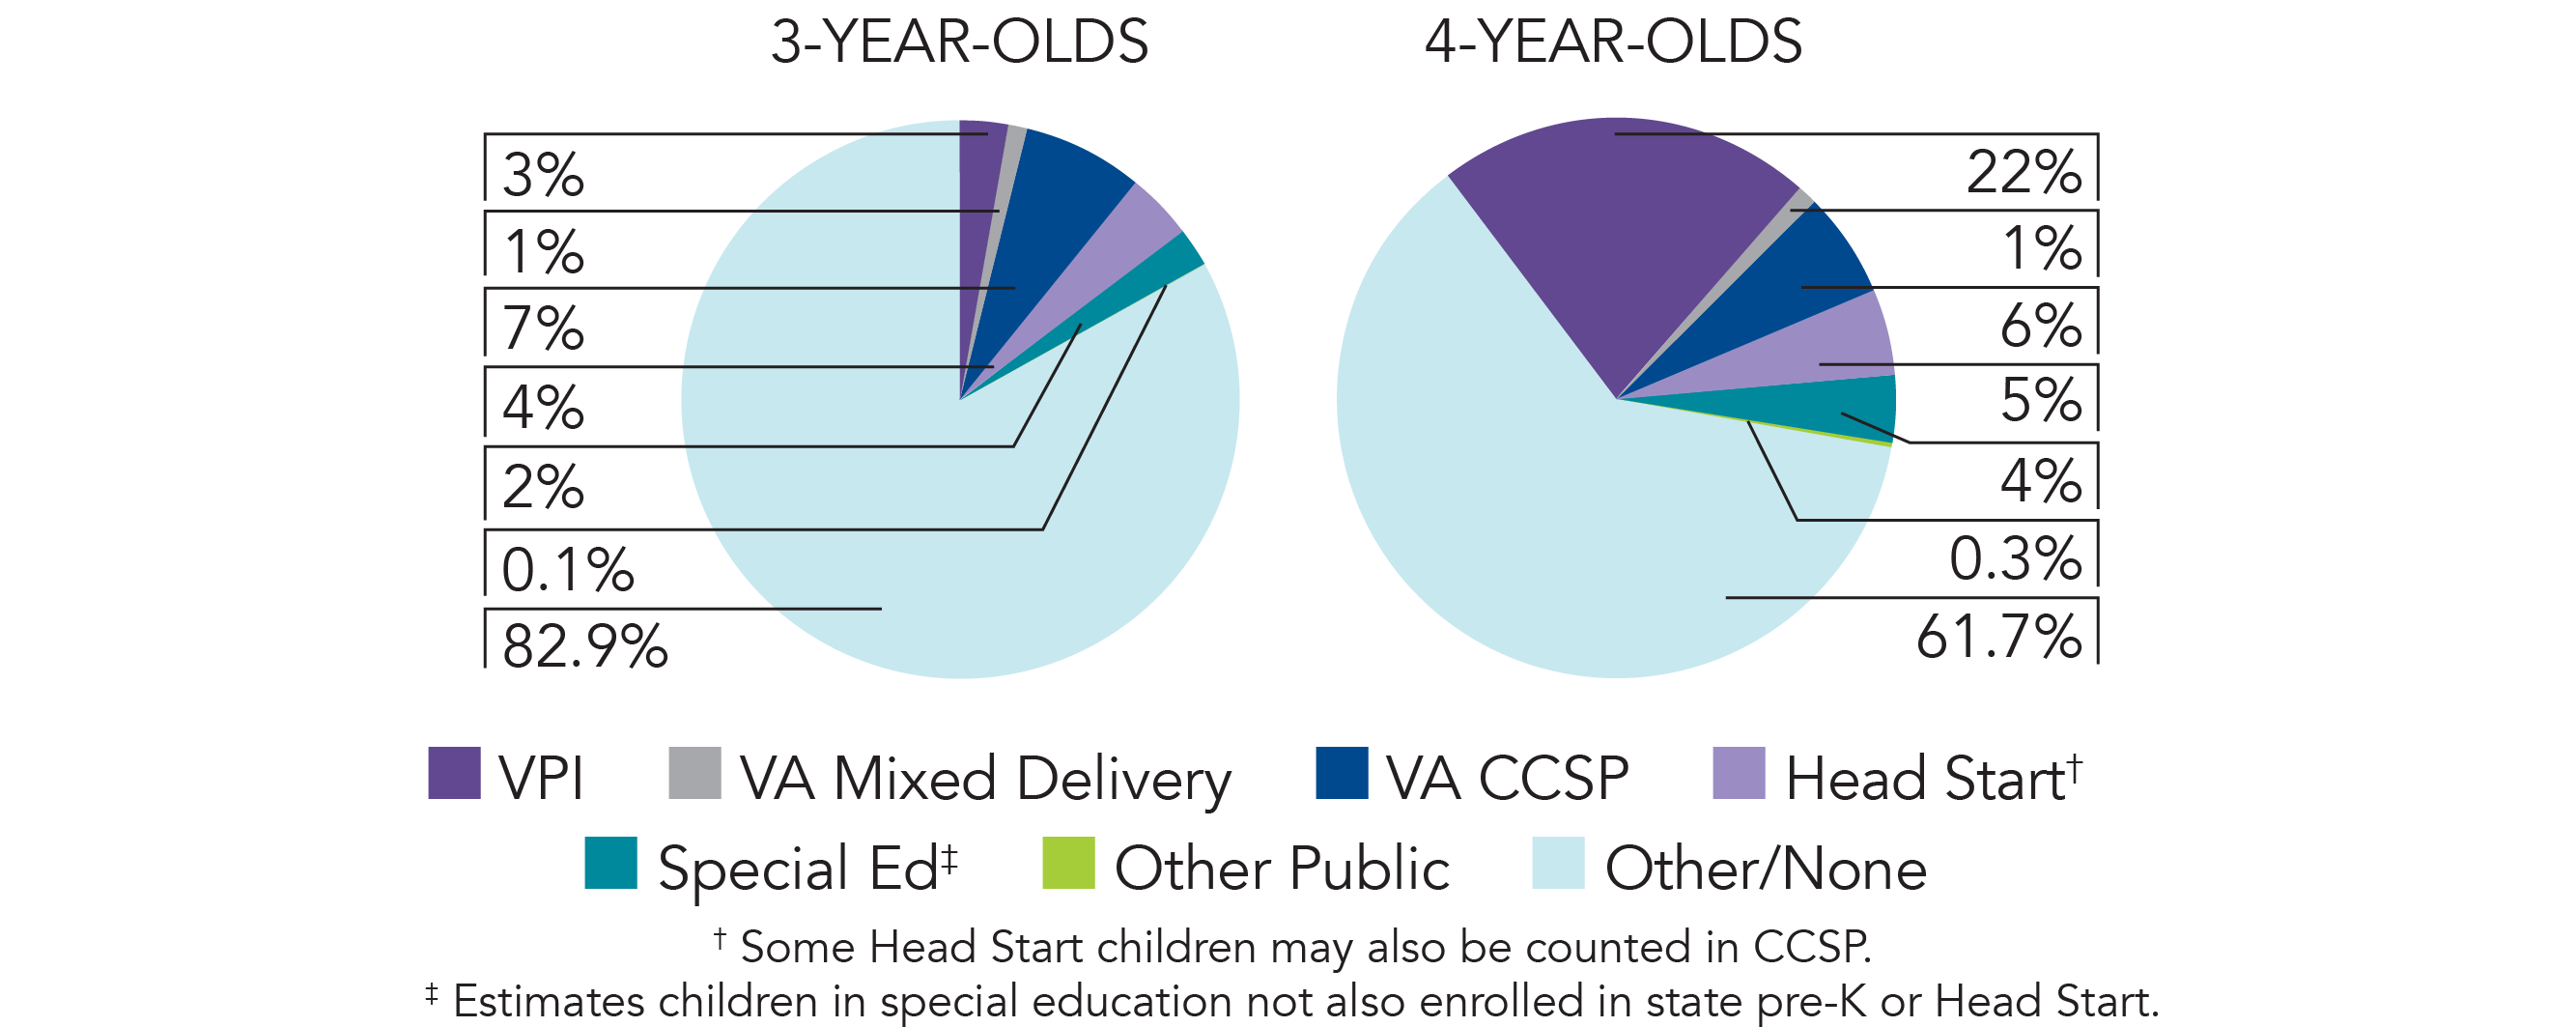
Previously, Virginia's Mixed Delivery program was included as a second state-funded preschool program in Virginia. Beginning in 2024-2025, Mixed Delivery Implemented a parental work related activity requirement and no longer meets NIEER's definition of a state-funded preschool program. NIEER included Virginia’s Child Care Subsidy Program (CCSP) in the Yearbook for the first time this year. Although CCSP does not meet NIEER’s definition of a state-funded preschool program, it is an important component of Virginia’s comprehensive early childhood system. Both CCSP and Mixed Delivery are described in the Yearbook but are not included in the enrollment or spending rankings, which reflect only VPI.
What's New
In 2023, Governor Youngkin introduced the Building Blocks for Virginia Families initiative and proposed a state budget that demonstrated a commitment to sustaining access to early care and education by using state general funds (SGF) to offset the expiration of federal COVID-19 relief funding. These historic state investments in the FY25–26 biennial budget ensured that no children lost services following the end of pandemic-era funding. The budget appropriated $366 million in state general funds in FY25 and $461 million in FY26 to support CCSP, Mixed Delivery, and VPI. As a result of these investments in Virginia’s public–private early childhood system, more children have access to publicly funded early learning slots than ever before. In addition, VPI reimbursement rates were rebenchmarked beginning in the 2024–2025 school year to better reflect current costs of care and quality standards in school-based settings. This rebenchmarking process will occur again in advance of the 2026–2027 school year.
Background
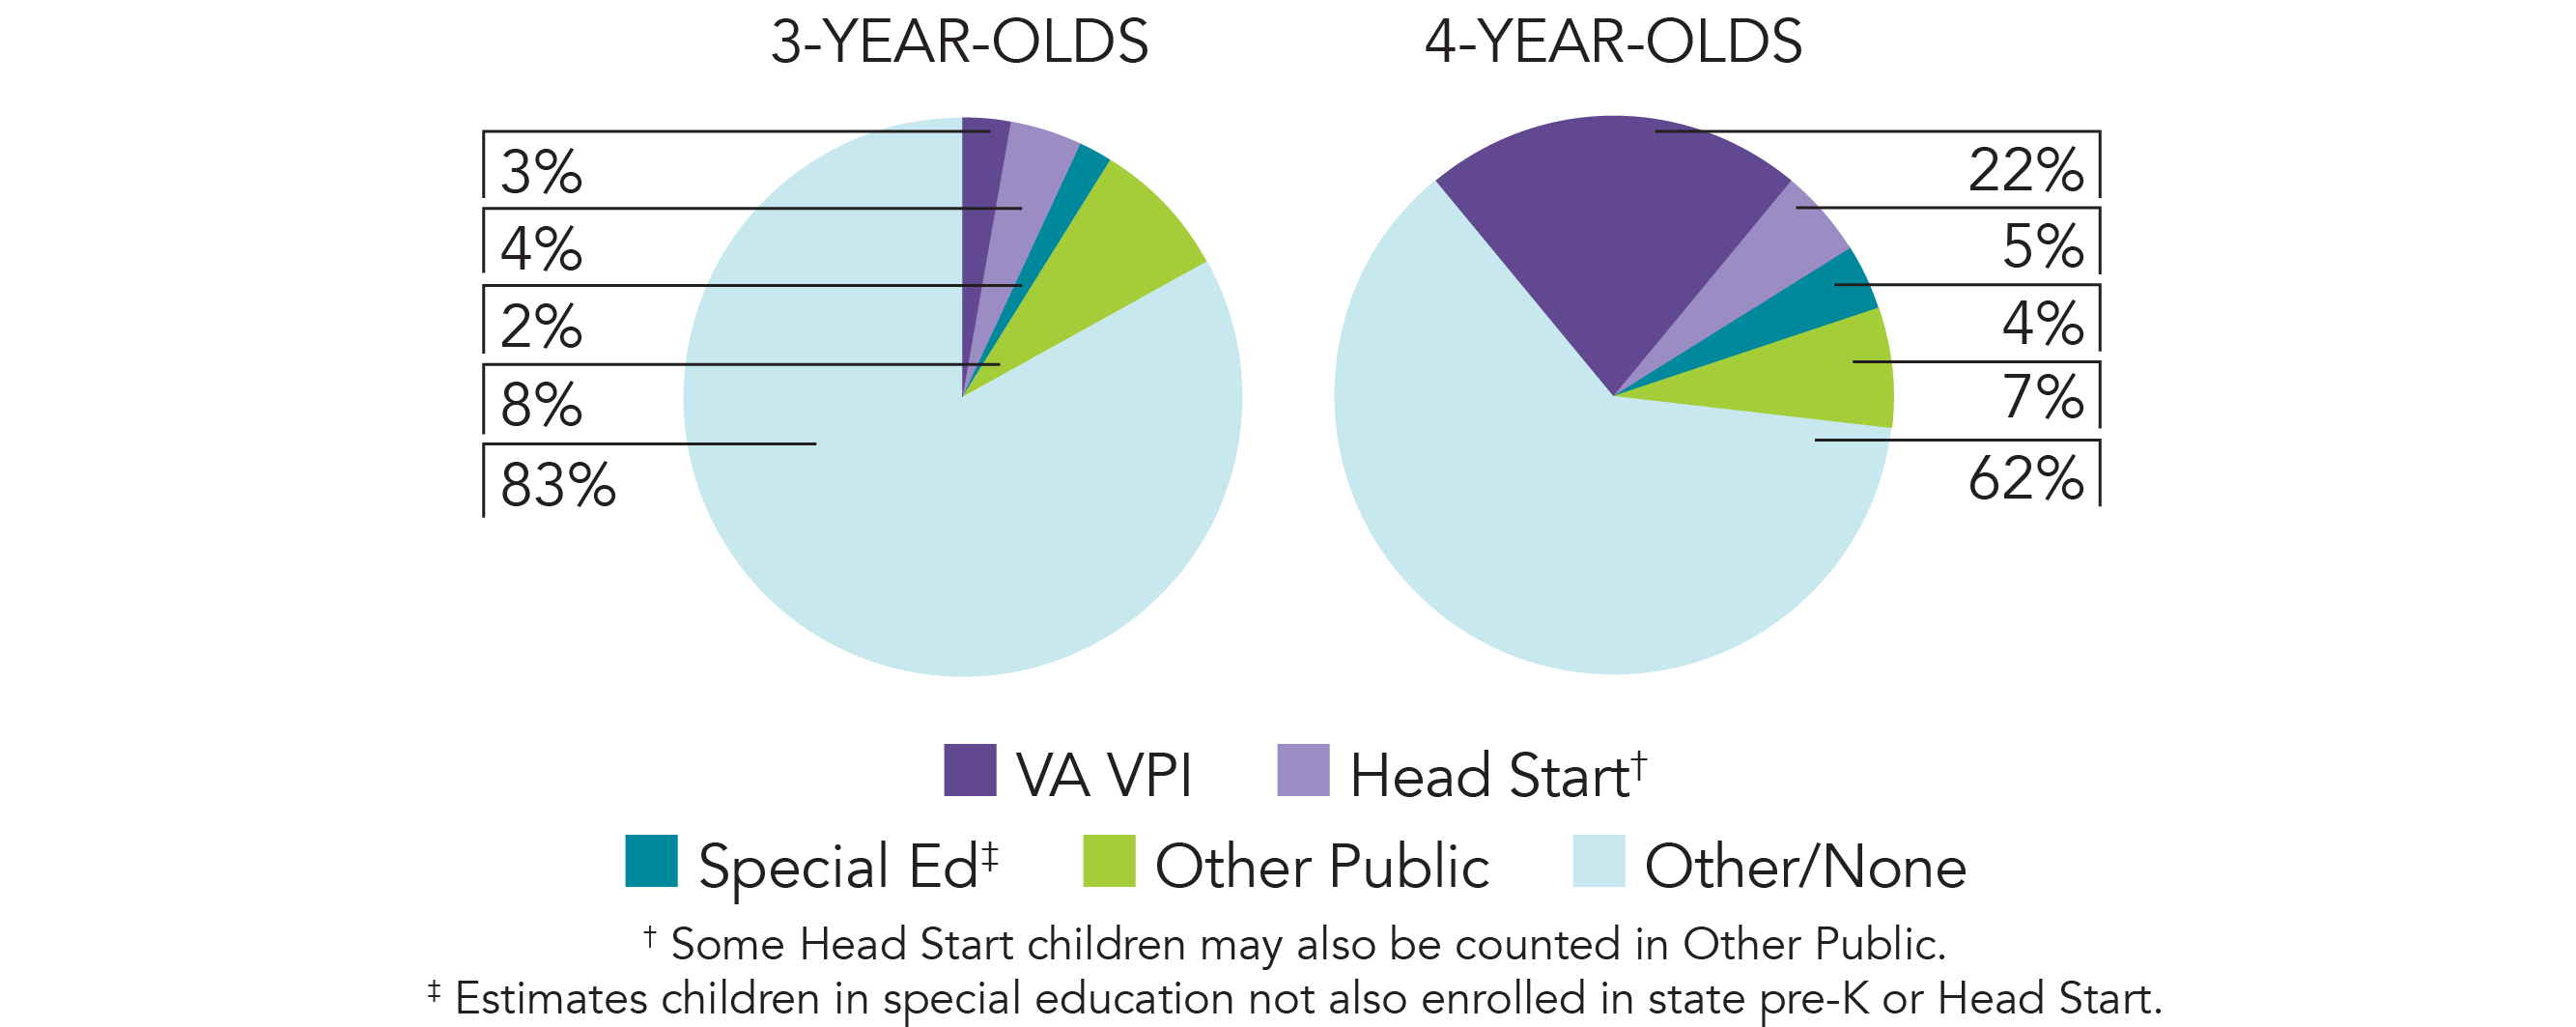
The Virginia Preschool Initiative (VPI) began in 1995 to serve at-risk 4-year-olds not enrolled in existing preschool programs. During the 2024-2025 school year, VPI programs operated in 98% of eligible school divisions. Programs are required to operate for a minimum of three hours per day, though 93% of children attend full-day programs throughout the school year. VPI is funded by an annual legislative appropriation of state general funds and a required local match based on the local composite index. The local match is capped at half the per-pupil amount. Funding for VPI is available to school divisions where there are at-risk 3- and 4-year-olds not served by Head Start. The first and second pages of Virginia’s profile page focus only on VPI. State rankings on this page reflect only the VPI program.
The Mixed Delivery program began during the 2016-2017 school year and was included in the State of Preschool Yearbook for the first time in 2022. This program is administered by the Virginia Early Childhood Foundation (VECF) as a public/private partnership and provides publicly funded early childhood care and education (ECCE) services in licensed, non-school-based and non-faith-based private ECCE settings. Eligible children are those who have been identified as at-risk for entering kindergarten without the necessary social and academic skills for success. The Mixed Delivery program fully covers the estimated cost of quality for full-day, year-round services.
Virginia also provides substantial support for the state’s Child Care Subsidy Program (CCSP). During the 2024–2025 school year, state funding for CCSP was approximately $200 million, with about 35% of expenditures supporting preschool-aged children. Children are eligible for CCSP if their family income is below 85% of State Median Income (SMI). Subsidized children are served across a diverse range of settings, including Head Start programs, private child care centers, faith-based programs (both with and without religious content), and family child care homes.
Mixed Delivery and CCSP have a parent work or education requirement and do not fully meet NIEER’s definition of a state-funded preschool program.
-
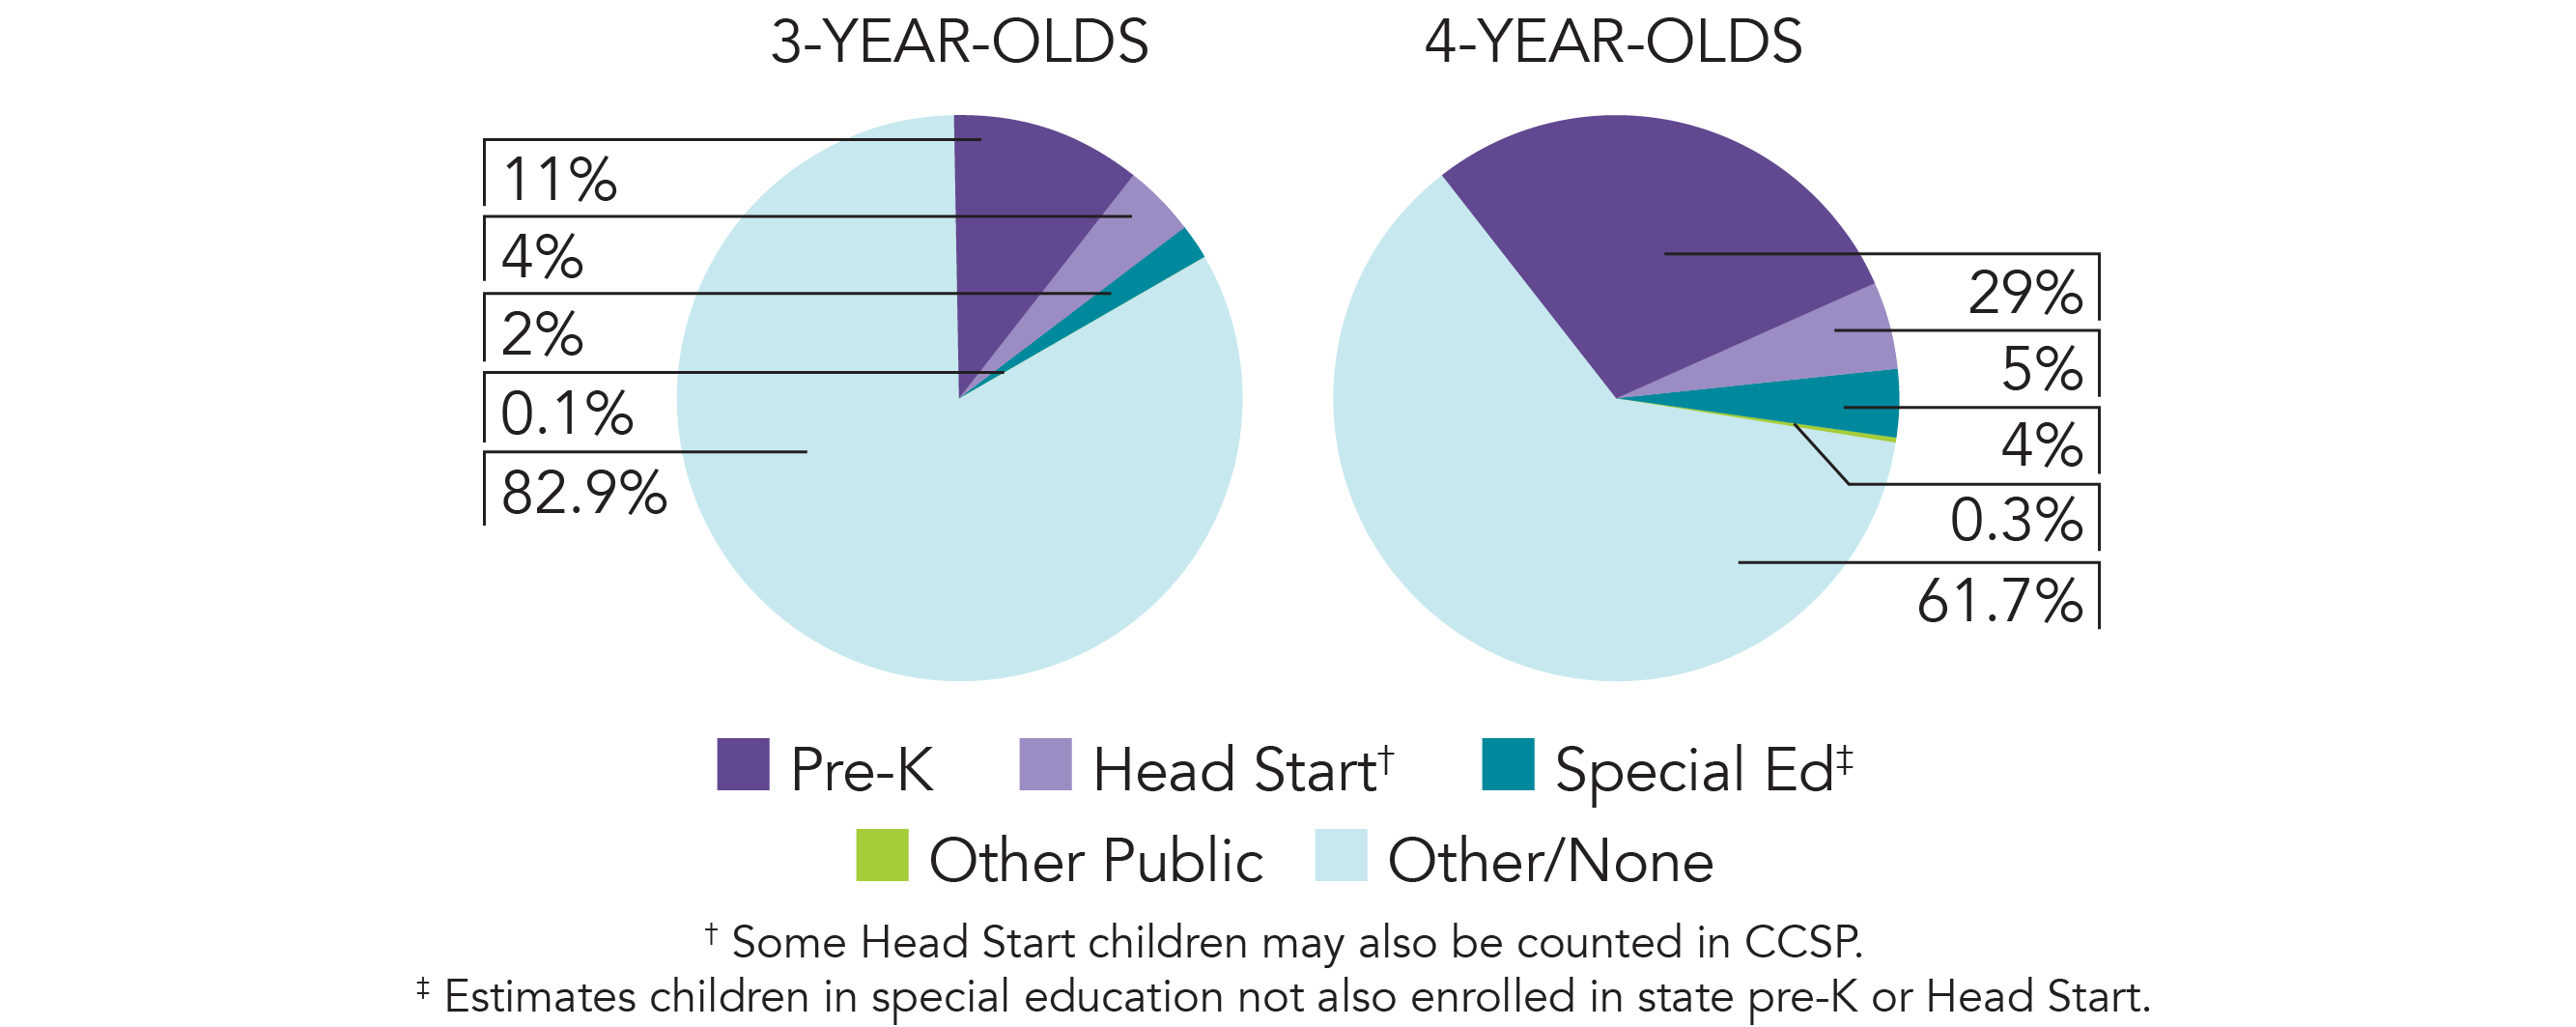
Access

Total state pre-K enrollment 38,557 Special education enrollment, ages 3 and 4 11,504 Federally funded Head Start enrollment, ages 3 and 4 9,080 State-funded Head Start enrollment, ages 3 and 4 0 Resources
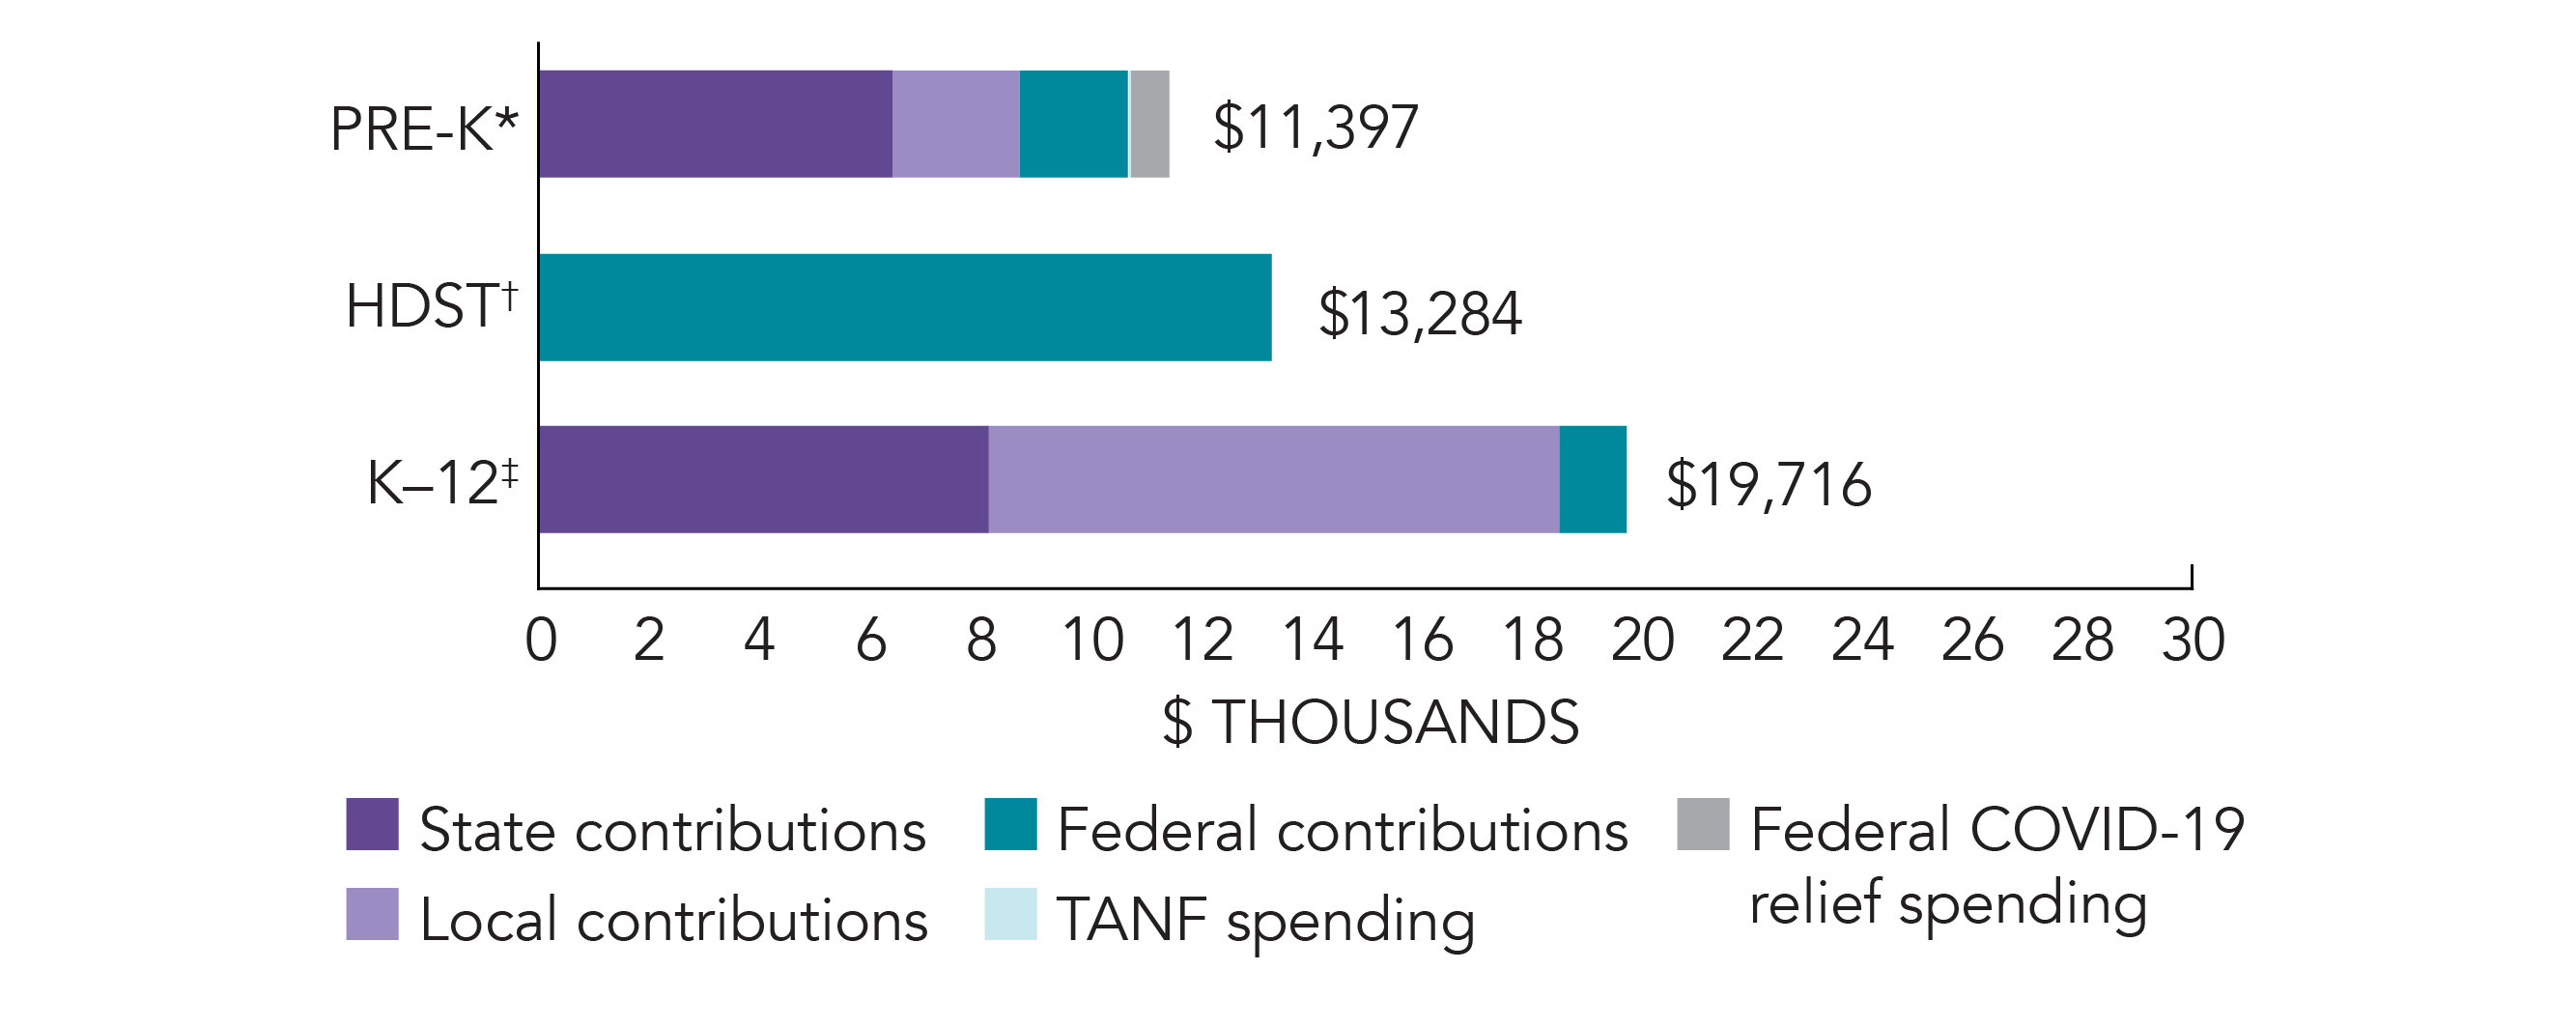
Total state pre-K spending $274,936,866 State Head Start spending $0 State spending per child enrolled $7,131 All reported spending per child enrolled* $11,397 
*Pre-K programs may receive additional funds from federal or local sources that are not included in this figure. †Head Start per-child spending includes funding only for 3- and 4-year-olds. ‡K–12 expenditures include capital spending as well as current operating expenditures.
-
Access

Total state pre-K enrollment 24,425 School districts that offer state program 98% (school divisions) Income requirement 200% FPL Minimum hours of operation 3 hours/day (half-day),
5.5 hours/day (full-day); 5 days/weekOperating schedule School or academic year Special education enrollment, ages 3 and 4 11,504 Federally funded Head Start enrollment, ages 3 and 4 9,080 Resources
Total state pre-K spending $149,480,336 Local match required? Yes State spending per child enrolled $6,120 All reported spending per child enrolled* $10,656 
*Pre-K programs may receive additional funds from federal or local sources that are not included in this figure. †Head Start per-child spending includes funding only for 3- and 4-year-olds. ‡K–12 expenditures include capital spending as well as current operating expenditures.

Virginia Preschool Initiative Quality Standards Checklist
| Policy | VA VPI Requirement | Benchmark | Meets Benchmark? |
|---|---|---|---|
For more information about the benchmarks, see the Executive Summary and the Roadmap to State pages. | 5benchmarks met | ||
| Early Learning & Development Standards Benchmark | Comprehensive, aligned, supported, culturally sensitive | Comprehensive, aligned, supported, culturally sensitive | |
| Curriculum Supports Benchmark | Approval process & supports | Approval process & supports | |
| Teacher Degree Benchmark | BA (public); HSD (nonpublic) | BA | |
| Teacher Specialized Training Benchmark | ECE, CD, ECE SpEd (public); None (nonpublic) | Specializing in pre-K | |
| Assistant Teacher Degree Benchmark | HSD (public); None (nonpublic) | CDA or equivalent | |
| Staff Professional Development Benchmark | 15 hours/school year | For teachers & assistants: At least 15 hours/year; individual PD plans; coaching | |
| Maximum Class Size Benchmark | 20 (3- & 4-year-olds) | 20 or lower | |
| Staff to Child Ratio Benchmark | 1:10 (3- & 4-year-olds) | 1:10 or better | |
| Screening & Referral Benchmark | Vision, hearing, health & more; Referrals not required | Vision, hearing & health screenings; & referral | |
| Continuous Quality Improvement System Benchmark | Structured classroom observations; Data used for program improvement | Structured classroom observations; data used for program improvement | |
-
Access

Total state pre-K enrollment 1,989 School districts that offer state program 54% (localities) Income requirement 200% FPL Minimum hours of operation 10 hours/day; 5 days/week Operating schedule Full calendar year Resources
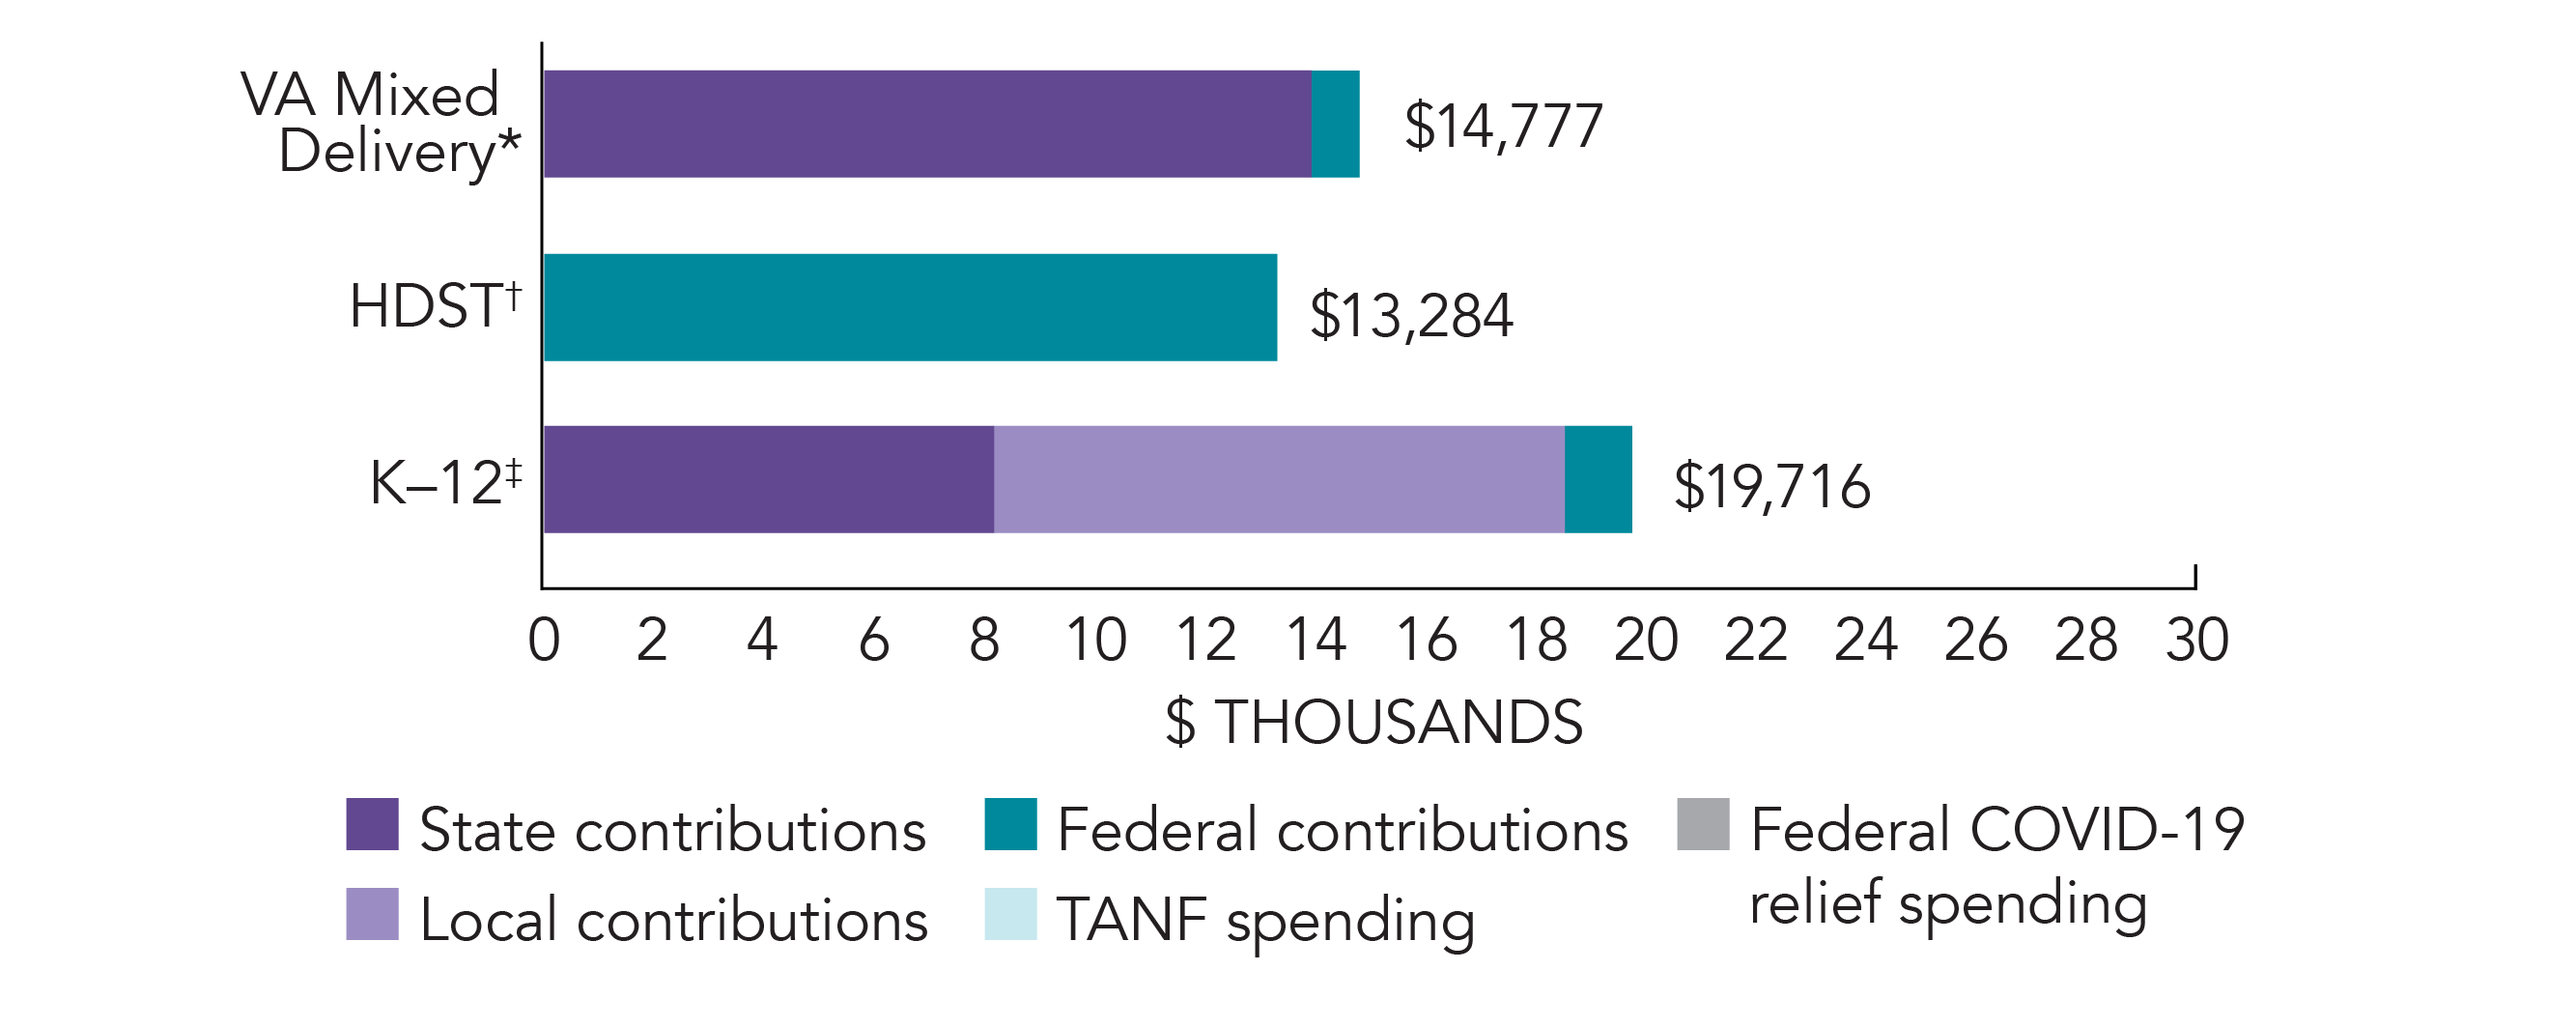
Total state pre-K spending $27,657,187 Local match required? No State spending per child enrolled $13,905 All reported spending per child enrolled* $14,777 
*Pre-K programs may receive additional funds from federal or local sources that are not included in this figure. †Head Start per-child spending includes funding only for 3- and 4-year-olds. ‡K–12 expenditures include capital spending as well as current operating expenditures.
Virginia Early Childhood Foundation Mixed Delivery Quality Standards Checklist
| Policy | VA Mixed Delivery Requirement | Benchmark | Meets Benchmark? |
|---|---|---|---|
For more information about the benchmarks, see the Executive Summary and the Roadmap to State pages. | 4benchmarks met | ||
| Early Learning & Development Standards Benchmark | Comprehensive, aligned, supported, culturally sensitive | Comprehensive, aligned, supported, culturally sensitive | |
| Curriculum Supports Benchmark | Approval process & supports | Approval process & supports | |
| Teacher Degree Benchmark | None | BA | |
| Teacher Specialized Training Benchmark | None | Specializing in pre-K | |
| Assistant Teacher Degree Benchmark | None | CDA or equivalent | |
| Staff Professional Development Benchmark | 16 hours/school year | For teachers & assistants: At least 15 hours/year; individual PD plans; coaching | |
| Maximum Class Size Benchmark | 30 (3- & 4-year-olds) | 20 or lower | |
| Staff to Child Ratio Benchmark | 1:10 (3- & 4-year-olds) | 1:10 or better | |
| Screening & Referral Benchmark | Immunization, full physical exam; Referrals not required | Vision, hearing & health screenings; & referral | |
| Continuous Quality Improvement System Benchmark | Structured classroom observations; Data used for program improvement | Structured classroom observations; data used for program improvement | |
-
Access
Total state pre-K enrollment 12,143 School districts that offer state program 100% (localities) Income requirement 85% SMI Minimum hours of operation Determined locally Operating schedule Full calendar year Resources
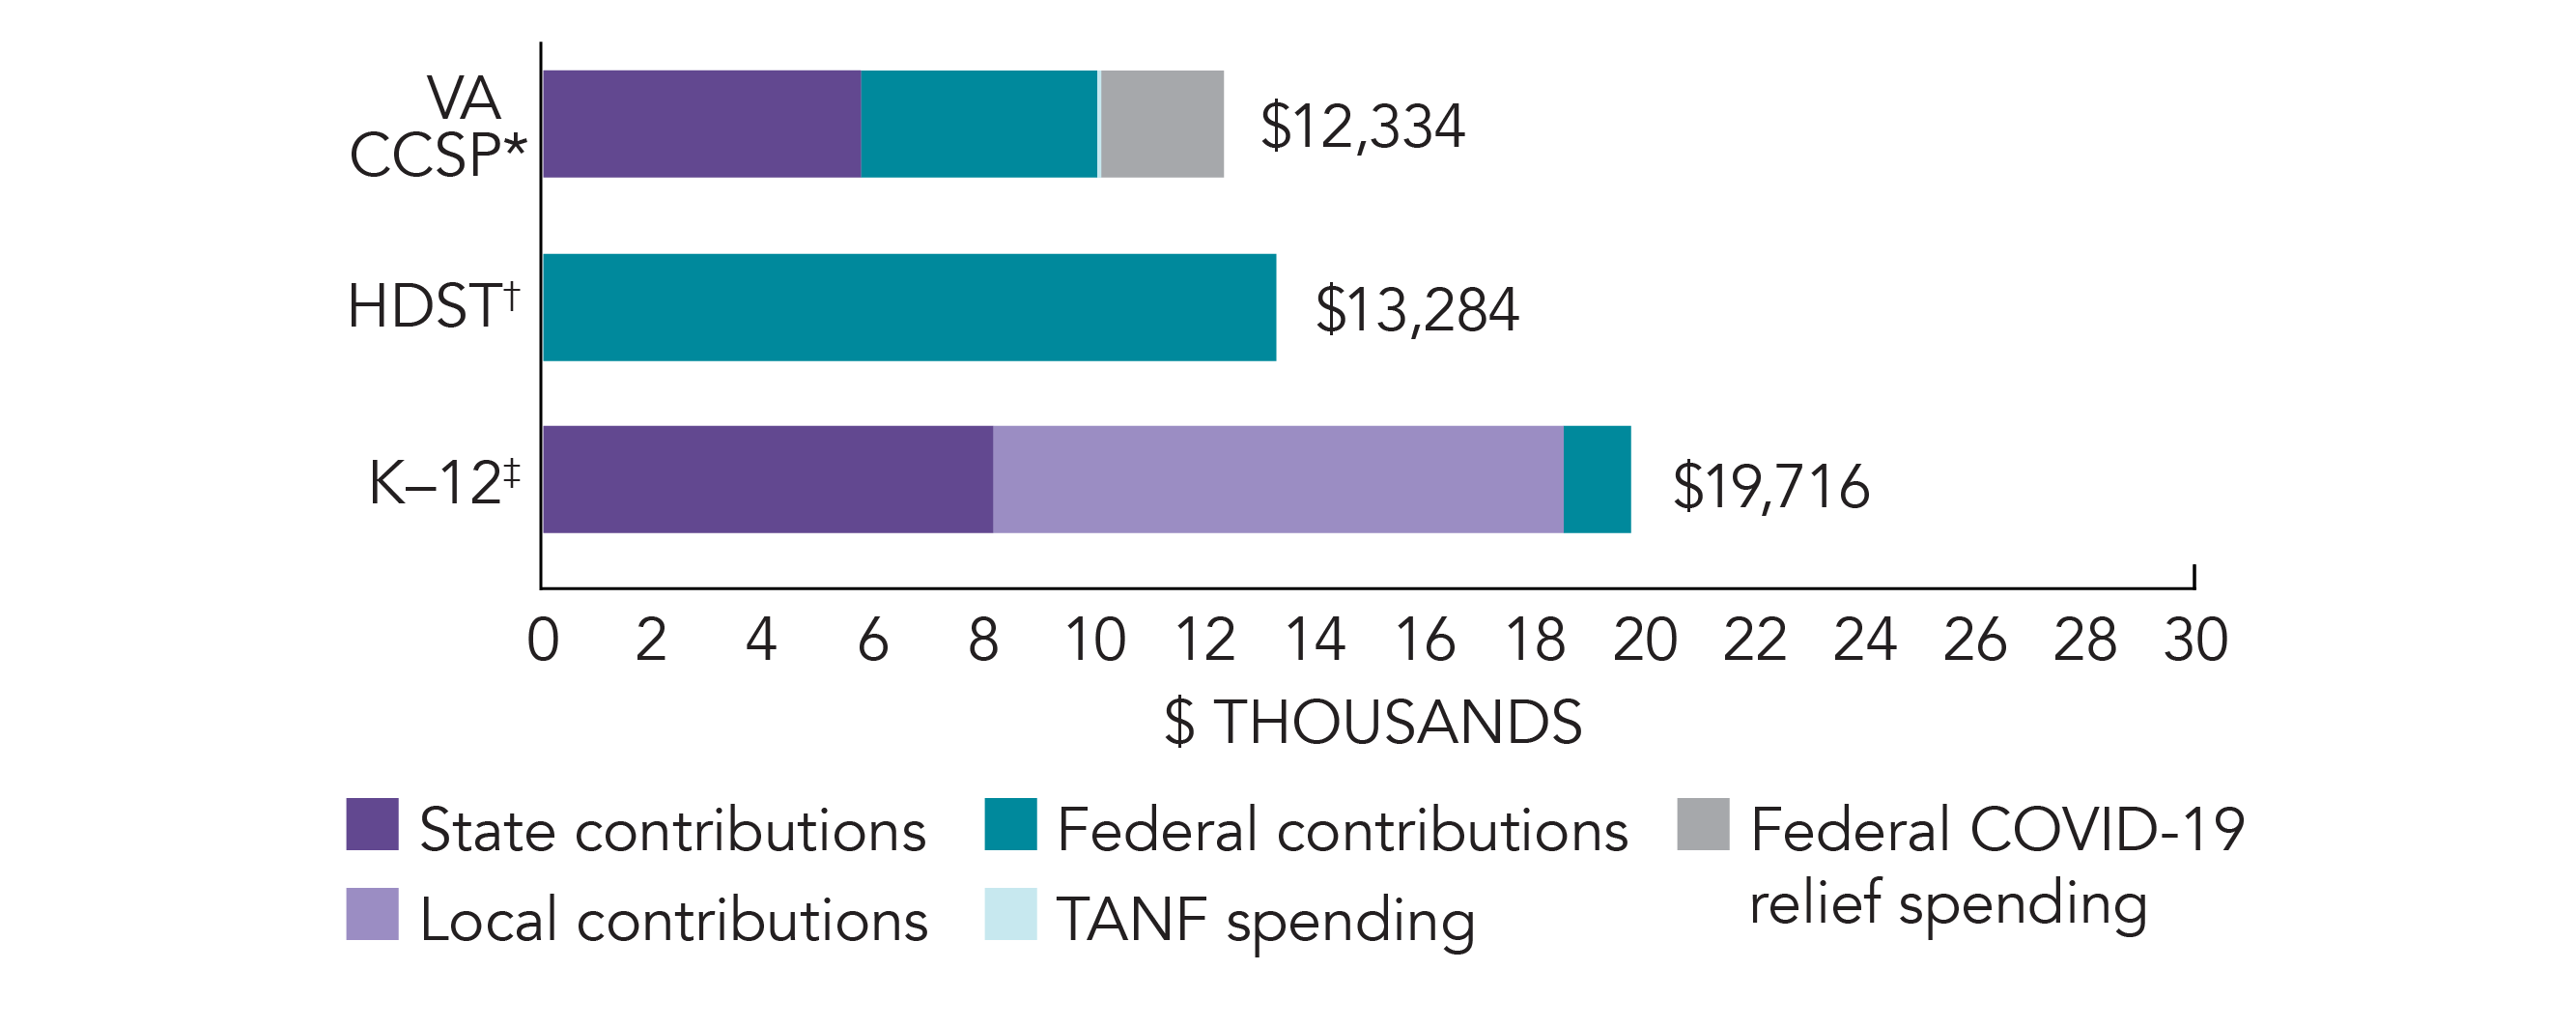
Total state pre-K spending $97,799,343 Local match required? No State spending per child enrolled $8,054 All reported spending per child enrolled* $12,334 
*Pre-K programs may receive additional funds from federal or local sources that are not included in this figure. †Head Start per-child spending includes funding only for 3- and 4-year-olds. ‡K–12 expenditures include capital spending as well as current operating expenditures.
Virginia Child Care Subsidy Program Quality Standards Checklist
| Policy | VA CCSP Requirement | Benchmark | Meets Benchmark? |
|---|---|---|---|
For more information about the benchmarks, see the Executive Summary and the Roadmap to State pages. | 3benchmarks met | ||
| Early Learning & Development Standards Benchmark | ELDS not required to be used | Comprehensive, aligned, supported, culturally sensitive | |
| Curriculum Supports Benchmark | Approval process & supports | Approval process & supports | |
| Teacher Degree Benchmark | None | BA | |
| Teacher Specialized Training Benchmark | None | Specializing in pre-K | |
| Assistant Teacher Degree Benchmark | None | CDA or equivalent | |
| Staff Professional Development Benchmark | 16 hours/school year | For teachers & assistants: At least 15 hours/year; individual PD plans; coaching | |
| Maximum Class Size Benchmark | 30 (3- & 4-year-olds) | 20 or lower | |
| Staff to Child Ratio Benchmark | 1:10 (3- & 4-year-olds) | 1:10 or better | |
| Screening & Referral Benchmark | Immunization, full physical exam; Referrals not required | Vision, hearing & health screenings; & referral | |
| Continuous Quality Improvement System Benchmark | Structured classroom observations; Data used for program improvement | Structured classroom observations; data used for program improvement | |