State of Preschool
Oregon
Access Rankings
4-year-Olds
36
3-year-Olds
14
Resource Rankings
State spending
3
All reported spending
3
Total Benchmarks Met
Of 10 benchmarks possible
7.7
Overview
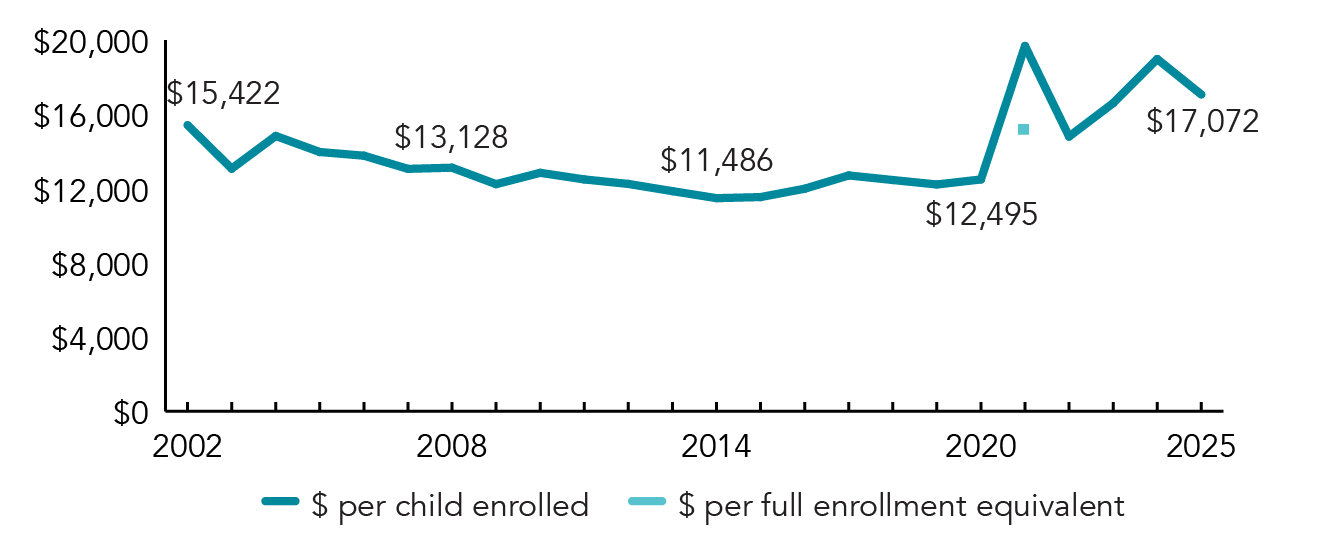
During the 2024-2025 school year, Oregon preschool enrolled 12,687 children, an increase of 90 from the prior year. State spending totaled $216,587,540, down $22,543,317 (9%), adjusted for inflation, since last year. State spending per child equaled $17,072 in 2024-2025, down $1,912 from 2023-2024, adjusted for inflation. Oregon met an average of 7.7 of 10 quality standards benchmarks.
What's New
During the 2025 legislative session, the legislature passed the Department of Early Learning and Care’s (DELC) budget for the 2025- 2027 biennium. Due to a lower-than-expected revenue forecast that included a projected decline in corporate tax revenue for Early Learning Account (ELA) programs, DELC was directed to implement $35 million in reductions to programs funded by the ELA.
DELC had discretion and authority when applying ELA reductions and prioritized preserving the current level of funds in communities. For Oregon Prenatal to Kindergarten, the total budget for the 2025-2027 biennium is $371,217,478. This will also result in a $810.60 increase per slot or an approximately 4.24% increase for program budgets. For Preschool Promise, the total budget for the 2025-2027 biennium is $179,017,019. This will also result in an increased cost per slot: $16,000 for base service, $1,150 for transportation, and an additional $2,040 for new slots during the first year. These budgets will allow DELC to maintain commitments to the slots requested by programs and approved.
In December 2025, Oregon was awarded a federal PDG B–5 Systems Building Grant totaling $7,355,305 to support system building and strengthen ECE programs in a mixed-delivery system, improve system efficiency and collaboration, and raise the overall quality of programs.
Background
Oregon has two state-funded preschool programs: the Oregon Prenatal to Kindergarten (OPK) program (formerly the Oregon Pre-Kindergarten program), established in 1987, and Preschool Promise, launched in 2016.
OPK provides comprehensive child and family development services for 3- and 4-year-old children from low-income families and is funded using the state general fund and Early Learning Account to serve additional Head Start-eligible children. Funding is awarded through a competitive process to all grantees. OPK includes Region X, Region XI, and Region XII Head Start grantees, and, even though most of the funding goes to Head Start grantees, there are six non-affiliated organizations that receive OPK funding. OPK programs must follow federal Head Start Performance Standards and the Head Start Early Learning Outcomes Framework. Eligibility for OPK also follows federal Head Start requirements.
Preschool Promise (PSP) is a mixed-delivery program for children from families with incomes up to 200% FPL. The mixed-delivery model includes public schools, child care centers, family child care homes, Head Start/OPK, Relief Nurseries, Education Service Districts, and other community-based organizations. While funding for Preschool Promise was initially administered through Early Learning Hubs, grantees received grants directly from DELC. Preschool Promise programs are required to participate in Spark, Oregon’s quality recognition and improvement system.
-
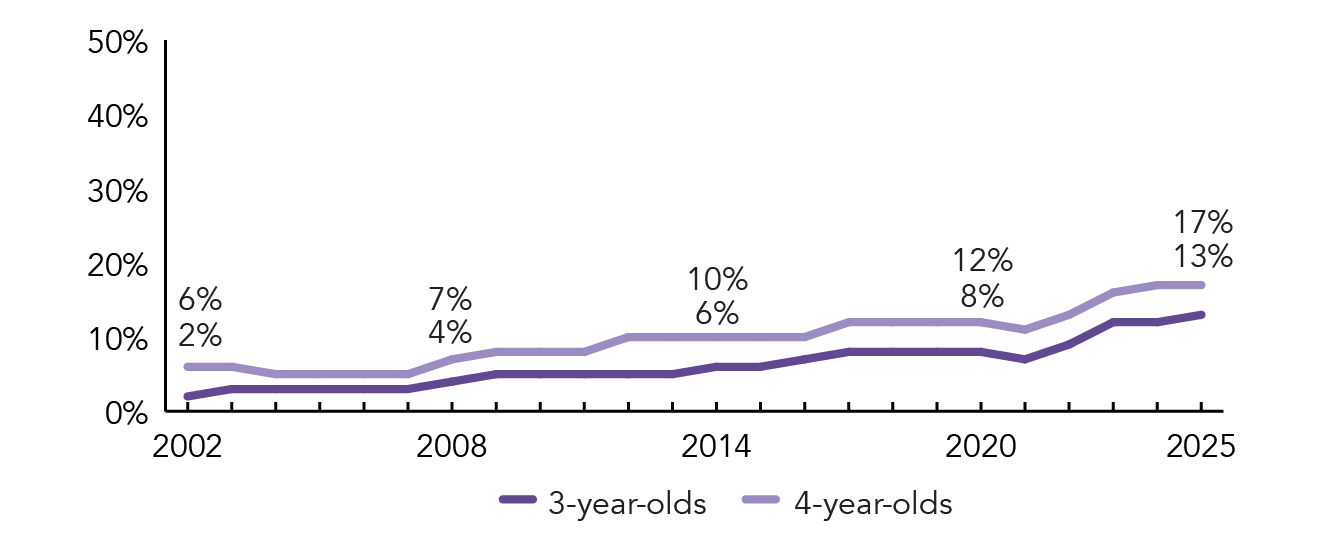
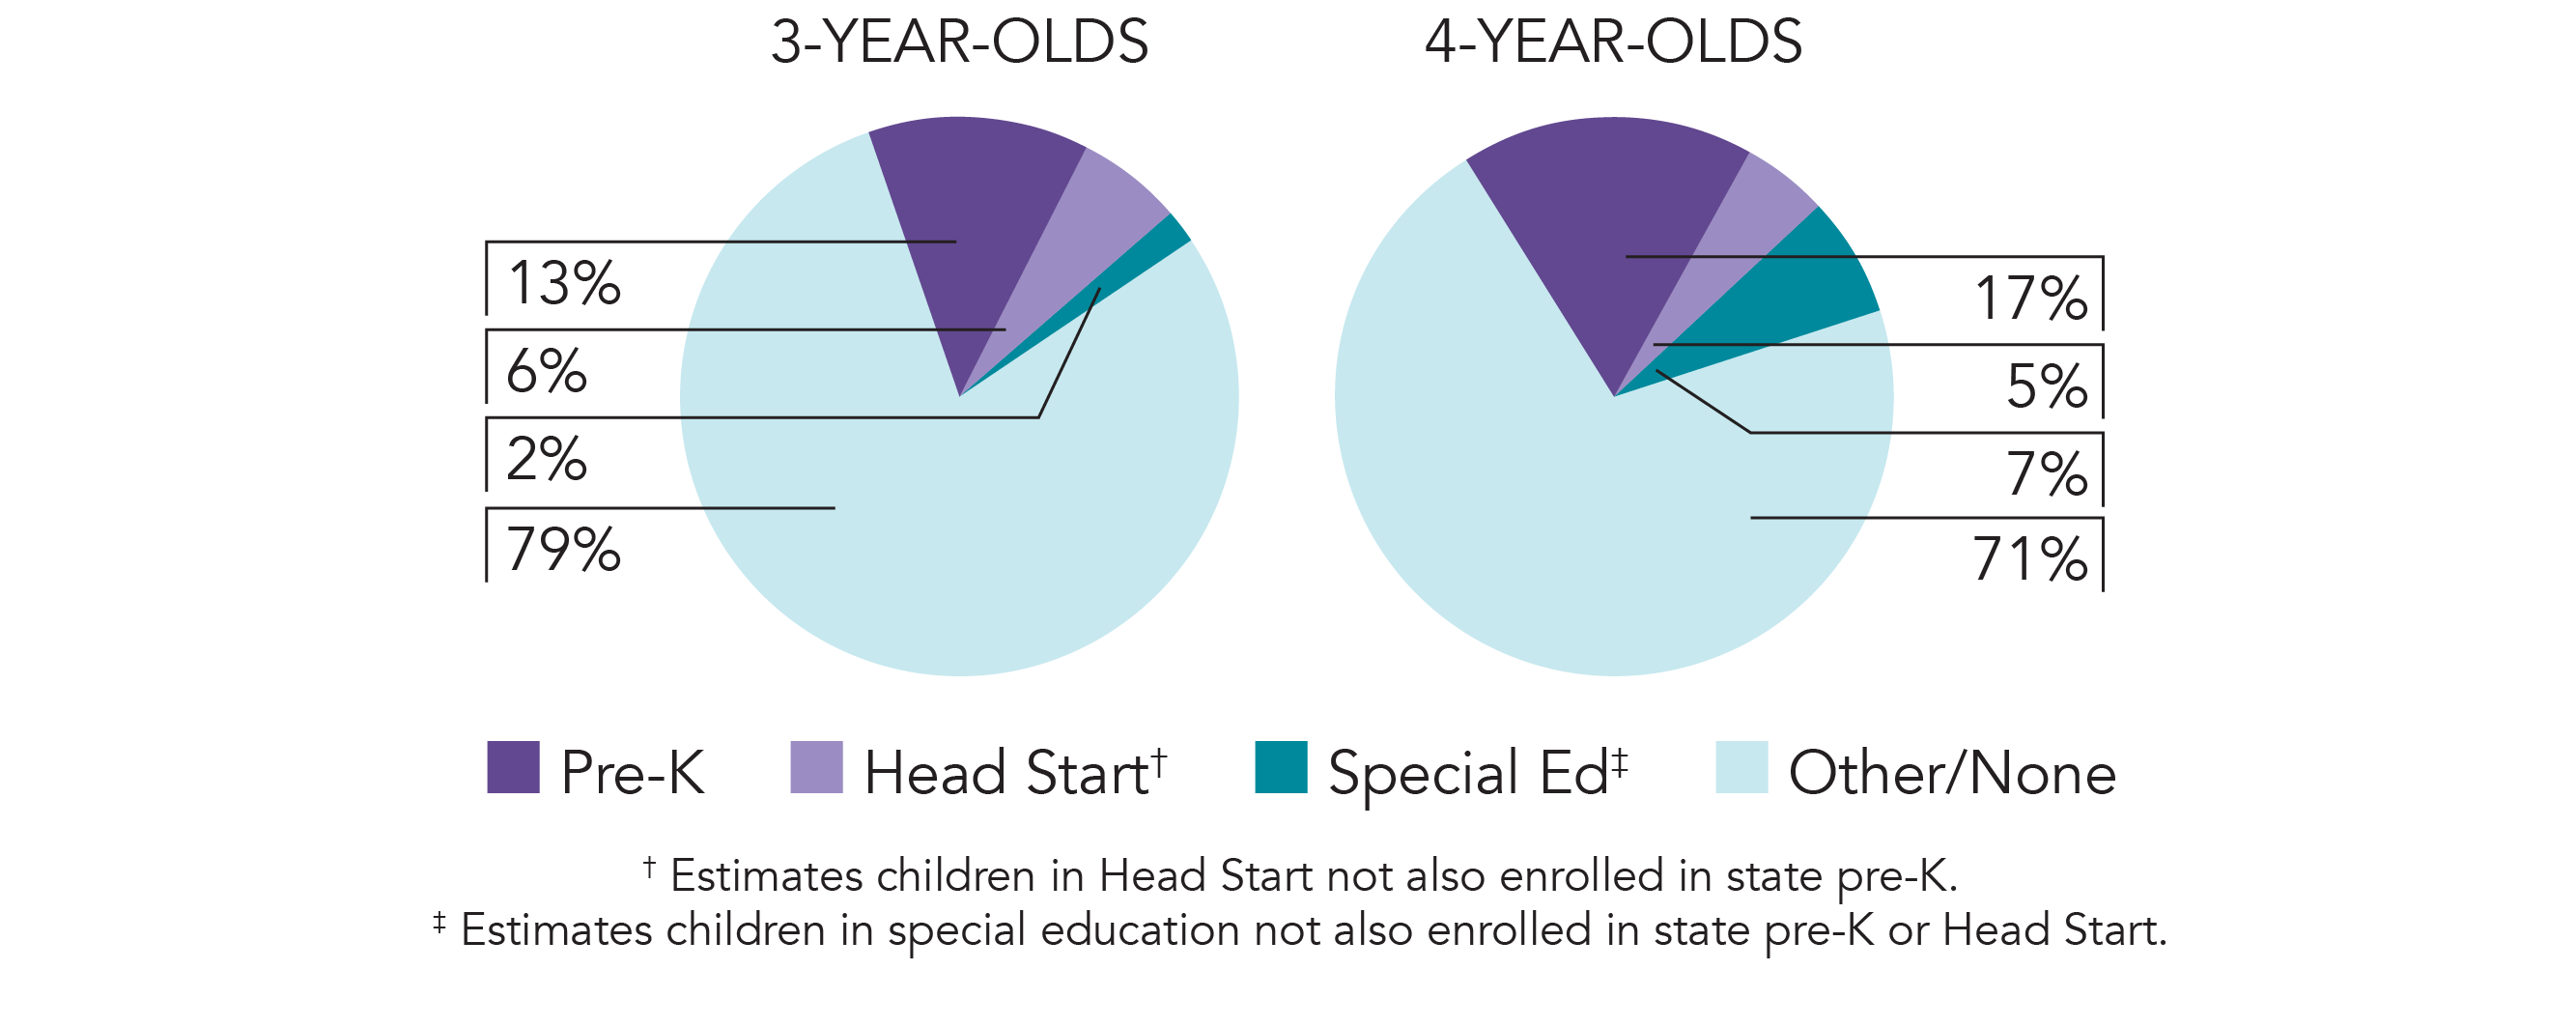
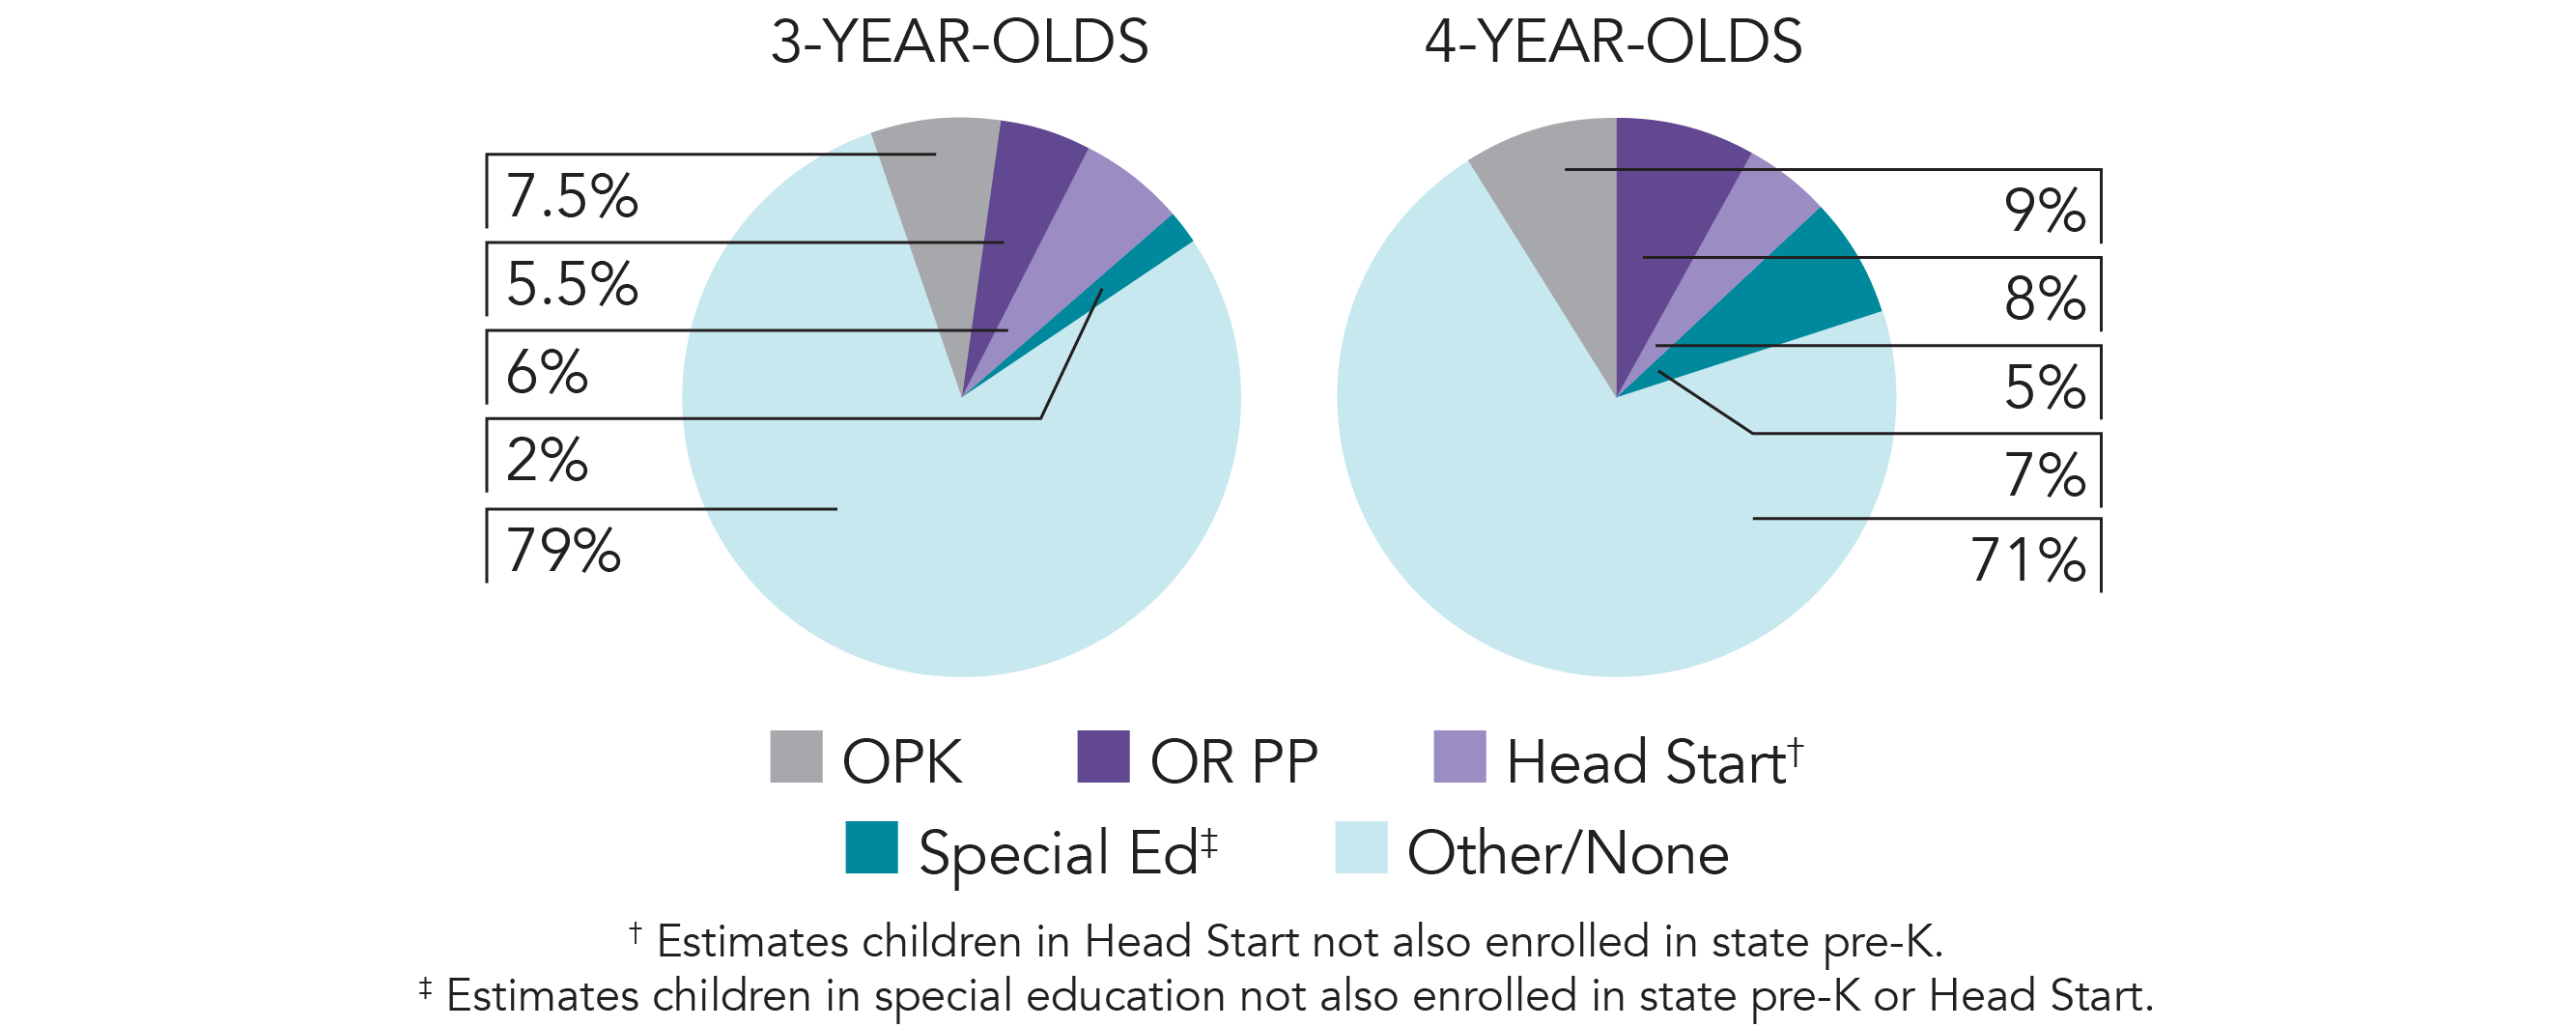
Access

Total state pre-K enrollment 12,687 Special education enrollment, ages 3 and 4 7,263 Federally funded Head Start enrollment, ages 3 and 4 4,261 State-funded Head Start enrollment, ages 3 and 4 7,150 Resources
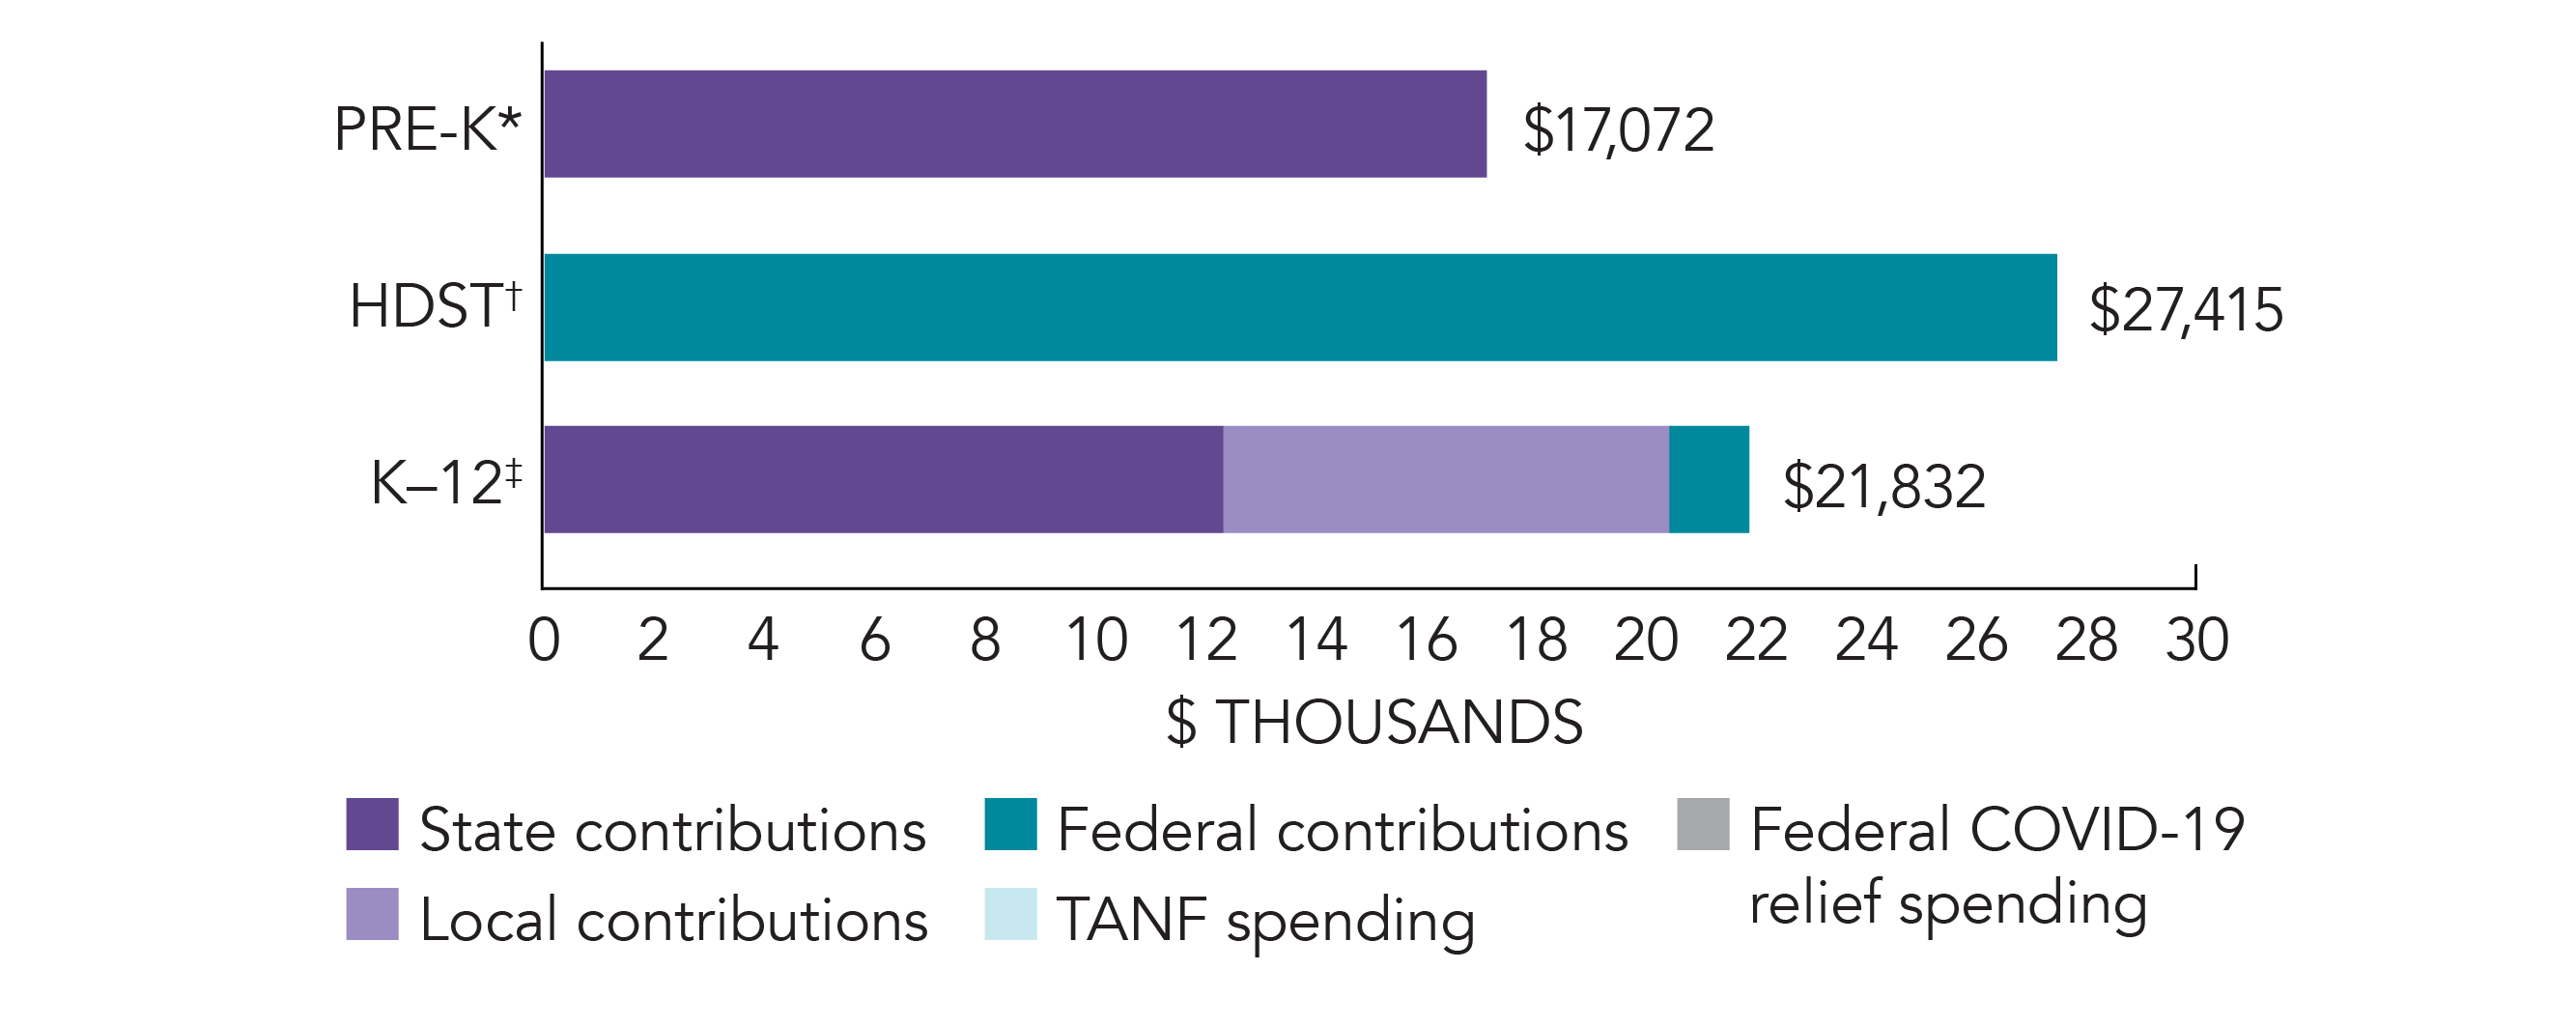
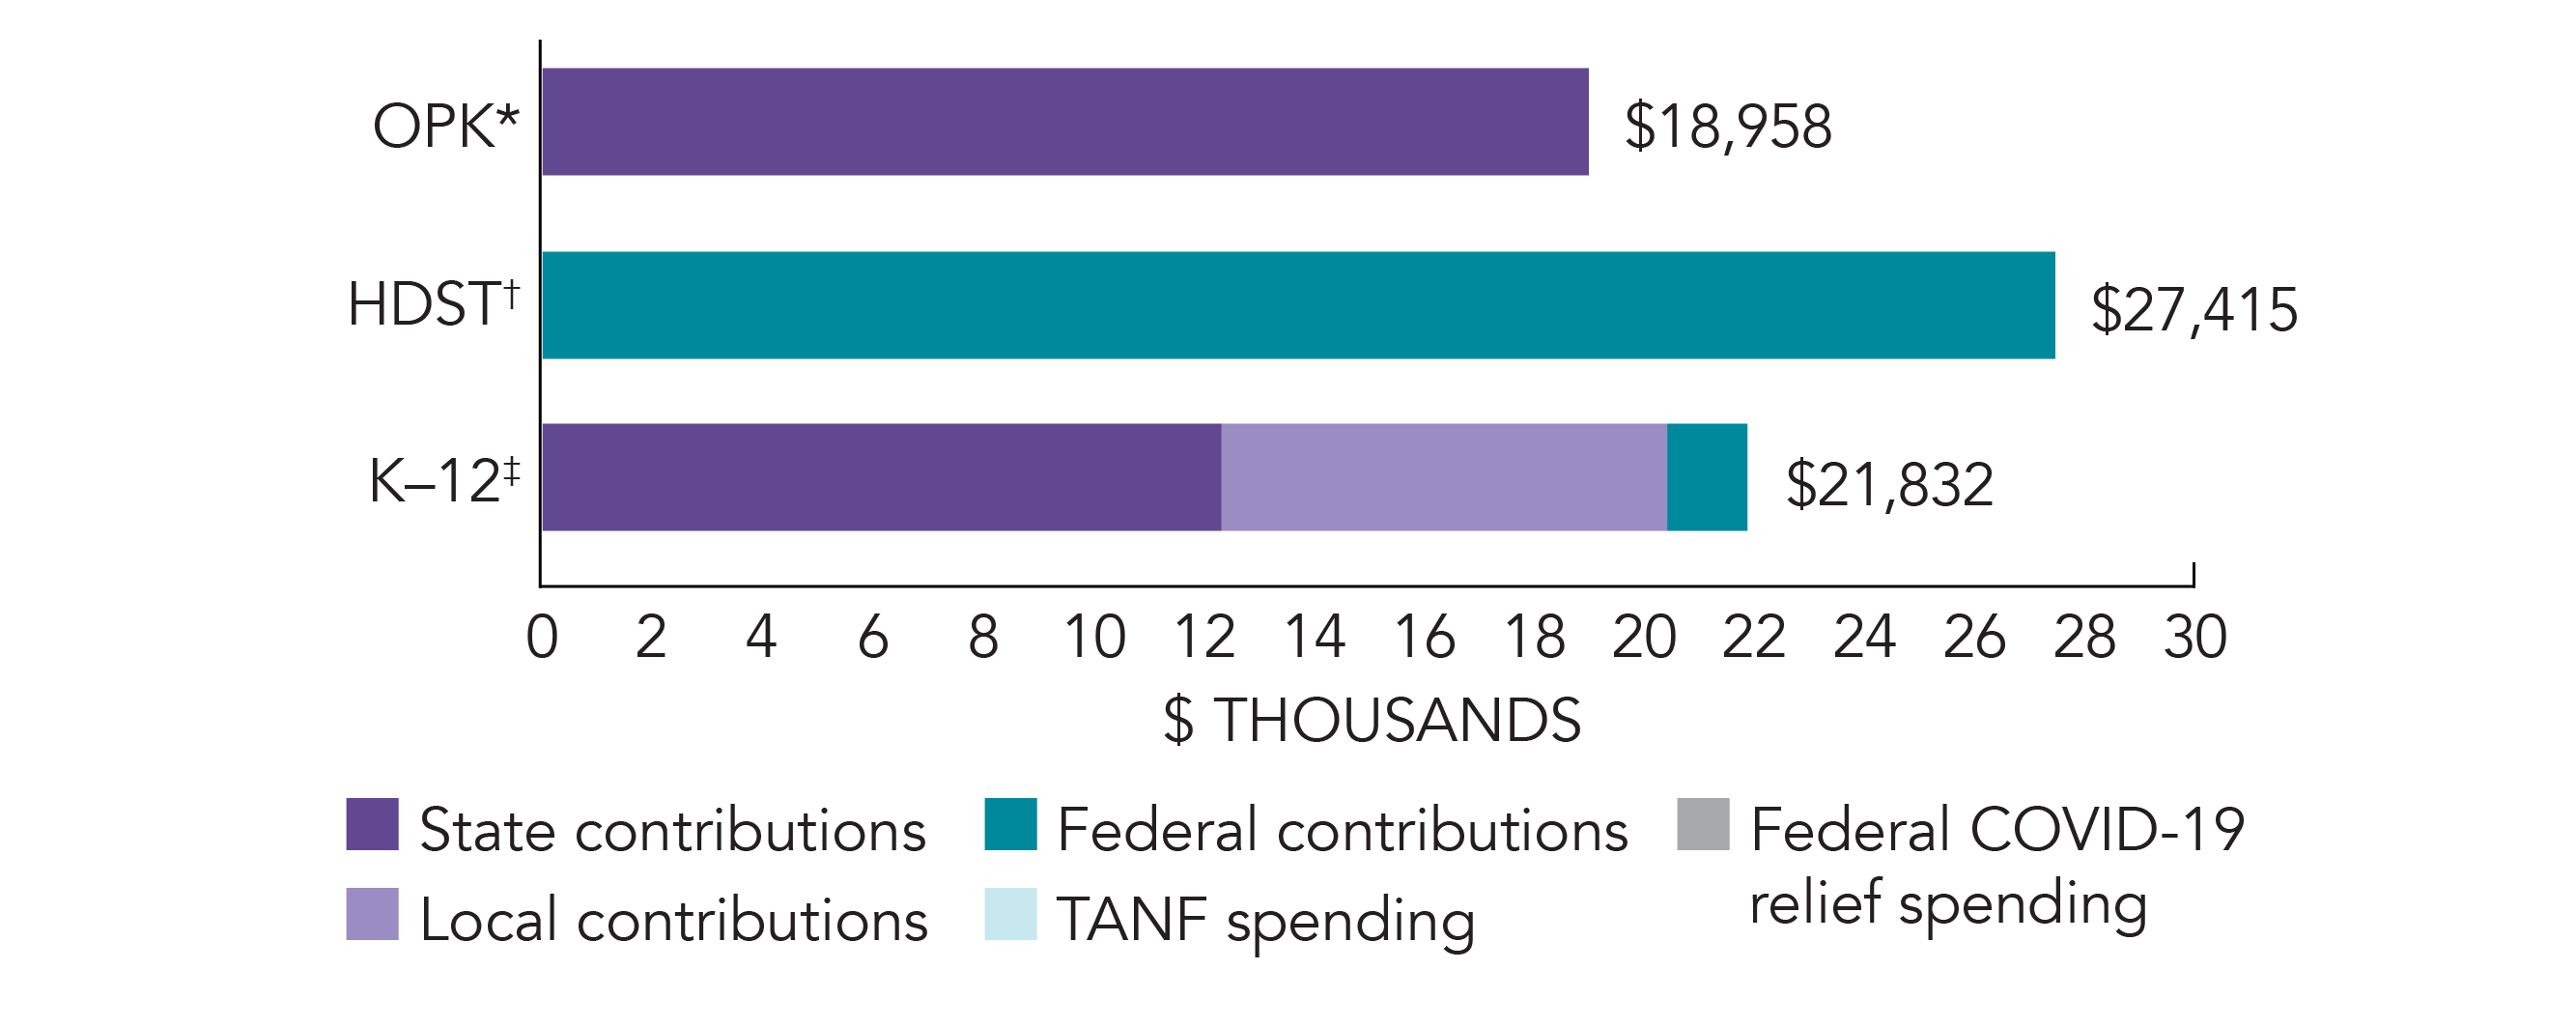
Total state pre-K spending $216,587,540 State Head Start spending $135,552,539 State spending per child enrolled $17,072 All reported spending per child enrolled* $17,072 
*Pre-K programs may receive additional funds from federal or local sources that are not included in this figure. †Head Start per-child spending includes funding only for 3- and 4-year-olds. ‡K–12 expenditures include capital spending as well as current operating expenditures.
-
Access

Total state pre-K enrollment 7,150 School districts that offer state program 100% (counties) Income requirement 100% FPL Minimum hours of operation 3.5 hours/day Operating schedule Determined locally Resources
Total state pre-K spending $135,552,539 Local match required? No State spending per child enrolled $18,958 All reported spending per child enrolled* $18,958 
*Pre-K programs may receive additional funds from federal or local sources that are not included in this figure. †Head Start per-child spending includes funding only for 3- and 4-year-olds. ‡K–12 expenditures include capital spending as well as current operating expenditures.
Oregon Prenatal to Kindergarten (OPK) Quality Standards Checklist
| Policy | OR Head Start/Pre-K/OPK Requirement | Benchmark | Meets Benchmark? |
|---|---|---|---|
For more information about the benchmarks, see the Executive Summary and the Roadmap to State pages. | 9benchmarks met | ||
| Early Learning & Development Standards Benchmark | Comprehensive, aligned, supported, culturally sensitive | Comprehensive, aligned, supported, culturally sensitive | |
| Curriculum Supports Benchmark | Approval process & supports | Approval process & supports | |
| Teacher Degree Benchmark | AA | BA | |
| Teacher Specialized Training Benchmark | ECE, CD | Specializing in pre-K | |
| Assistant Teacher Degree Benchmark | CDA | CDA or equivalent | |
| Staff Professional Development Benchmark | 24 hours/year; PD Plans; Coaching | For teachers & assistants: At least 15 hours/year; individual PD plans; coaching | |
| Maximum Class Size Benchmark | 17 (3-year-olds); 20 (4-year-olds) | 20 or lower | |
| Staff to Child Ratio Benchmark | 2:17 (3-year-olds); 1:10 (4-year-olds) | 1:10 or better | |
| Screening & Referral Benchmark | Vision, hearing, health & more | Vision, hearing & health screenings; & referral | |
| Continuous Quality Improvement System Benchmark | Structured classroom observations; Data used for program improvement | Structured classroom observations; data used for program improvement | |
-
Access
Total state pre-K enrollment 5,537 School districts that offer state program 100% (Early Learning Hub Regions); 97% (counties) Income requirement 200% FPL Minimum hours of operation 6 hours/day; 4 days/week Operating schedule School or academic year Resources
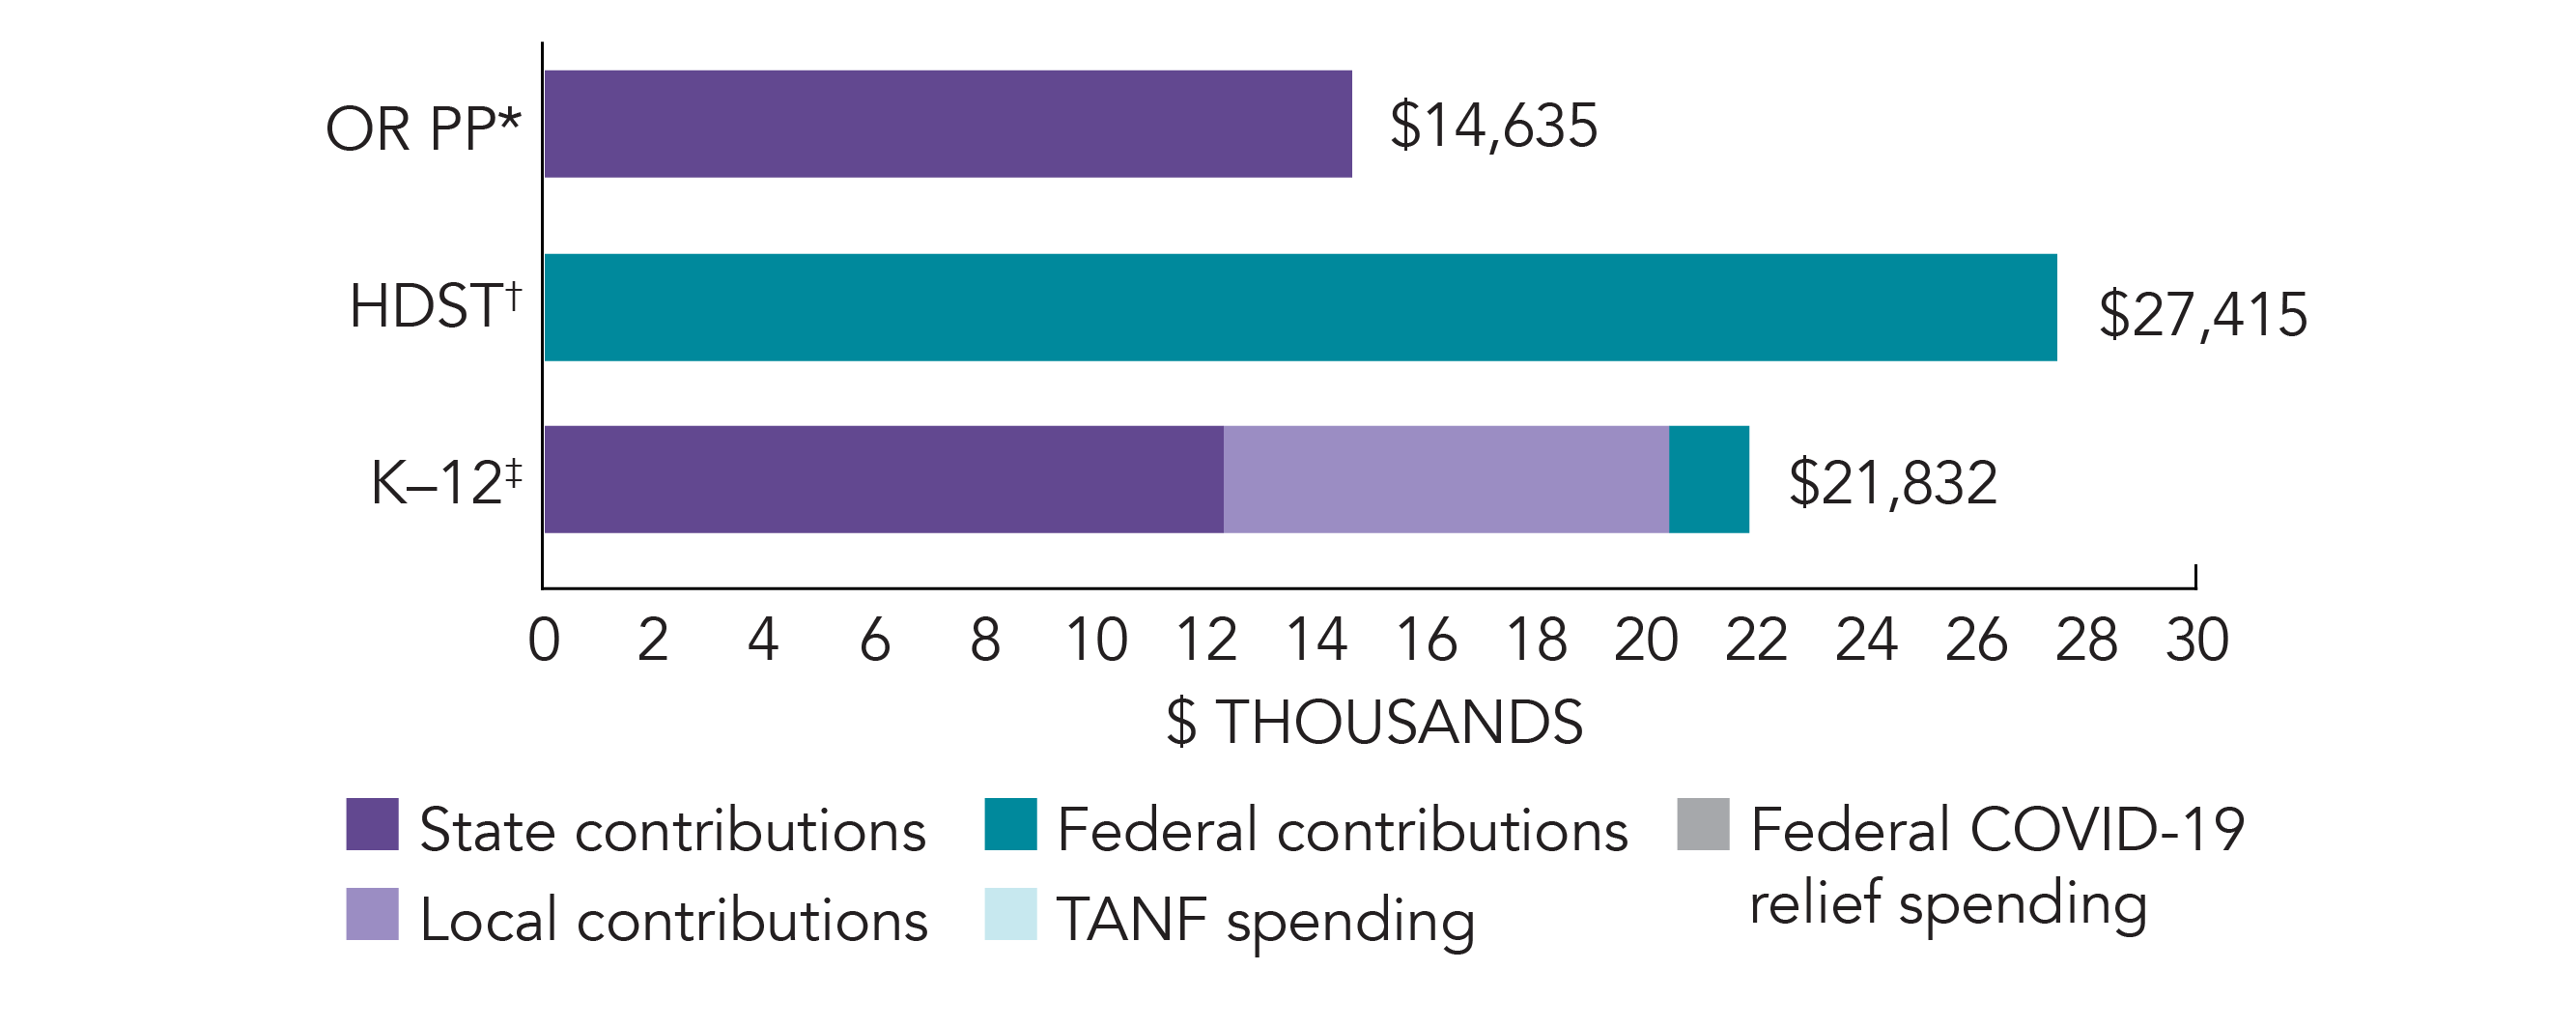
Total state pre-K spending $81,035,000 Local match required? No State spending per child enrolled $14,635 All reported spending per child enrolled* $14,635 
*Pre-K programs may receive additional funds from federal or local sources that are not included in this figure. †Head Start per-child spending includes funding only for 3- and 4-year-olds. ‡K–12 expenditures include capital spending as well as current operating expenditures.
Oregon Preschool Promise Quality Standards Checklist
| Policy | OR Preschool Promise Requirement | Benchmark | Meets Benchmark? |
|---|---|---|---|
For more information about the benchmarks, see the Executive Summary and the Roadmap to State pages. | 6benchmarks met | ||
| Early Learning & Development Standards Benchmark | Comprehensive, aligned, supported, culturally sensitive | Comprehensive, aligned, supported, culturally sensitive | |
| Curriculum Supports Benchmark | Approval process & supports | Approval process & supports | |
| Teacher Degree Benchmark | CDA | BA | |
| Teacher Specialized Training Benchmark | ECE or CDA | Specializing in pre-K | |
| Assistant Teacher Degree Benchmark | Other | CDA or equivalent | |
| Staff Professional Development Benchmark | 20 hours/year; PD plans (teachers & assistants not meeting education requirements); Coaching | For teachers & assistants: At least 15 hours/year; individual PD plans; coaching | |
| Maximum Class Size Benchmark | 18, or 20 with a waiver (3- & 4-year-olds) | 20 or lower | |
| Staff to Child Ratio Benchmark | 1:10 with 18, 1:9 with 20 (3- & 4-year-olds) | 1:10 or better | |
| Screening & Referral Benchmark | Immunizations, Developmental; Referrals | Vision, hearing & health screenings; & referral | |
| Continuous Quality Improvement System Benchmark | Structured classroom observations; Data used for program improvement | Structured classroom observations; data used for program improvement | |