State of Preschool
North Carolina
Access Rankings
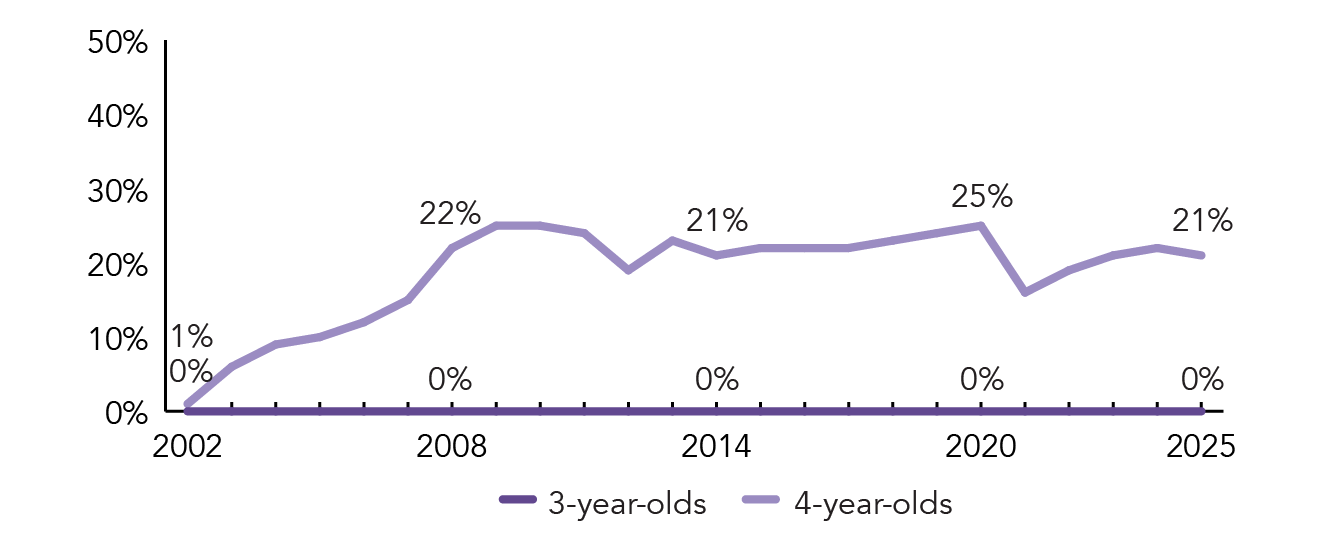
4-year-Olds
32
3-year-Olds
None Served
Resource Rankings
State spending
27
All reported spending
26
Total Benchmarks Met
Of 10 benchmarks possible
9*
Overview
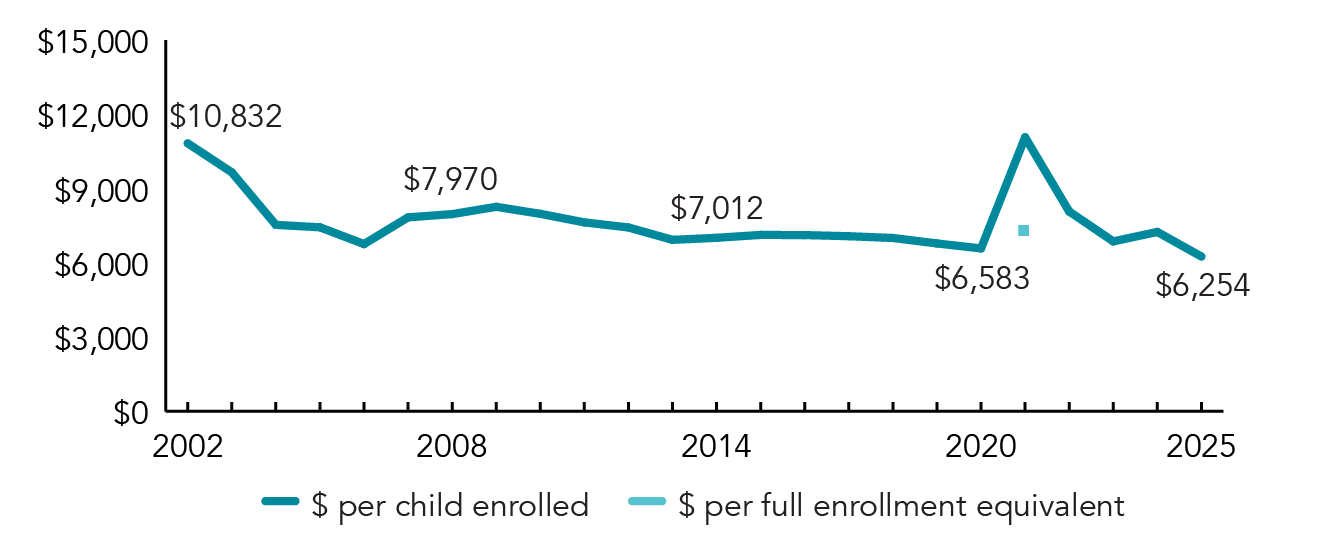
During the 2024-2025 school year, North Carolina preschool enrolled 26,707 children, a decrease of 597 from the prior year. State spending totaled $98,840,868 and $68,186,143 in TANF funds also supported the program, down $30,896,434 (16%), adjusted for inflation, since last year. State spending per child (including TANF funds) equaled $6,254 in 2024-2025, down $995 from 2023-2024, adjusted for inflation. North Carolina met 9 of 10 quality standards benchmarks.
What's New
In September 2024, North Carolina was one of 10 states, and D.C. awarded a 3-year federal renewal Preschool Development Grant B-5 (PDG B-5) totaling $9,000,000 annually. PDG B-5 builds on past successes to enhance the state’s early care and learning network through strengthening ECE programs in its mixed delivery system, supporting the ECE workforce, increasing family involvement in ECE programs, improving ECE program quality, expanding access to early childhood services, and creating seamless learning experiences from birth to kindergarten.
Background
North Carolina has provided state-funded pre-kindergarten education since 2001, originally via the More at Four Pre-Kindergarten Program. In 2011-2012, the program was renamed the North Carolina Pre-Kindergarten (NC Pre-K) Program, and administrative control moved from the Department of Public Instruction to the DHHS. NC Pre-K enrolls at-risk 4-year-olds from low-income families who have not participated in other early childhood programs. NC Pre-K programs are required to operate 6.5 hours per day for 36 weeks each year and serve as many eligible children as funding levels permit. Eligibility requires children to be in a household with income at or below 75% SMI, but up to 20% of children may be in a household with a higher income if they have another designated risk factor such as a developmental delay or identified disability, a chronic health condition, or limited English proficiency.
Funding for NC Pre-K includes state general appropriations and North Carolina Education Lottery receipts, federal funds, and a local contribution, with the majority of funding from the state. NC Pre-K classrooms operate statewide in settings such as privately licensed Head Start programs, childcare centers, and public schools. All programs, whether in public or private settings, must earn high quality ratings under the state child-care licensing system to participate in NC Pre-K and the state’s subsidy system. NC Pre-K sets a maximum class size of 20 four-year-olds and requires a staff-child ratio of 1:10. Lead teachers must have a bachelor’s degree and hold or be working towards a birth-through-kindergarten license. Classroom staff are required to use approved curricula and formative assessments aligned with the state’s early learning standards. Staff conduct ongoing formative assessments to gather information about each child’s growth and skill development, as well as to inform instruction.
North Carolina Pre-Kindergarten Program
Access
| |
| Total state pre-K enrollment | 26,707 |
| School districts that offer state program | 100% (counties) |
| Income requirement | 75% SMI |
| Minimum hours of operation | 6.5 hours/day; 5 days/week |
| Operating schedule | School or academic year |
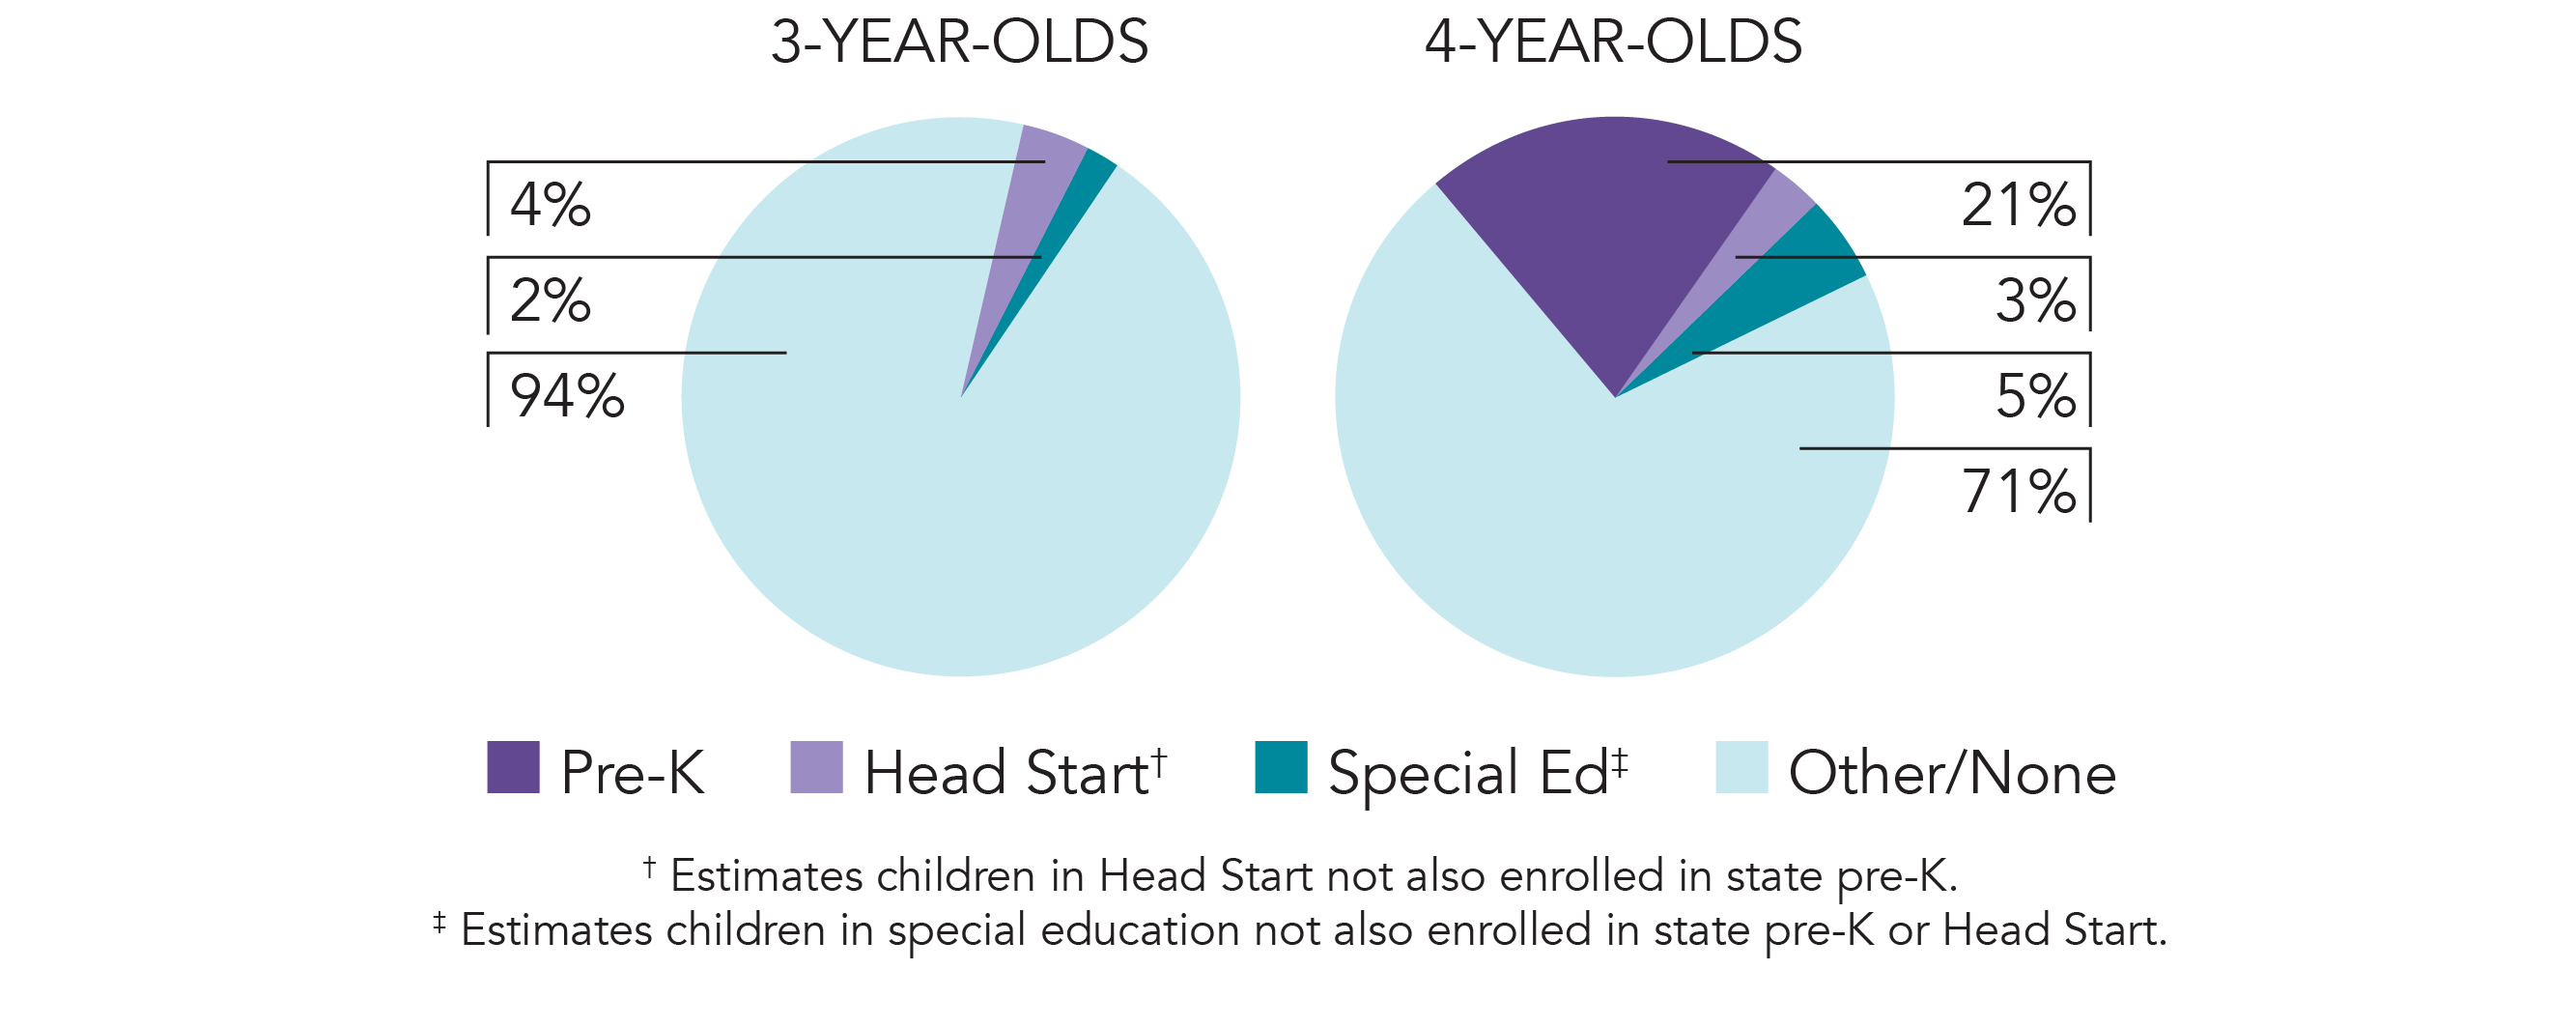
| Special education enrollment, ages 3 and 4 | 12,141 |
| Federally funded Head Start enrollment, ages 3 and 4 | 12,742 |
| State-funded Head Start enrollment, ages 3 and 4 | 0 |
Resources
| Total state pre-K spending | $167,027,011 |
| Local match required? | Yes |
| State Head Start spending | $0 |
| State spending per child enrolled | $6,254 |
| All reported spending per child enrolled* | $8,722 |
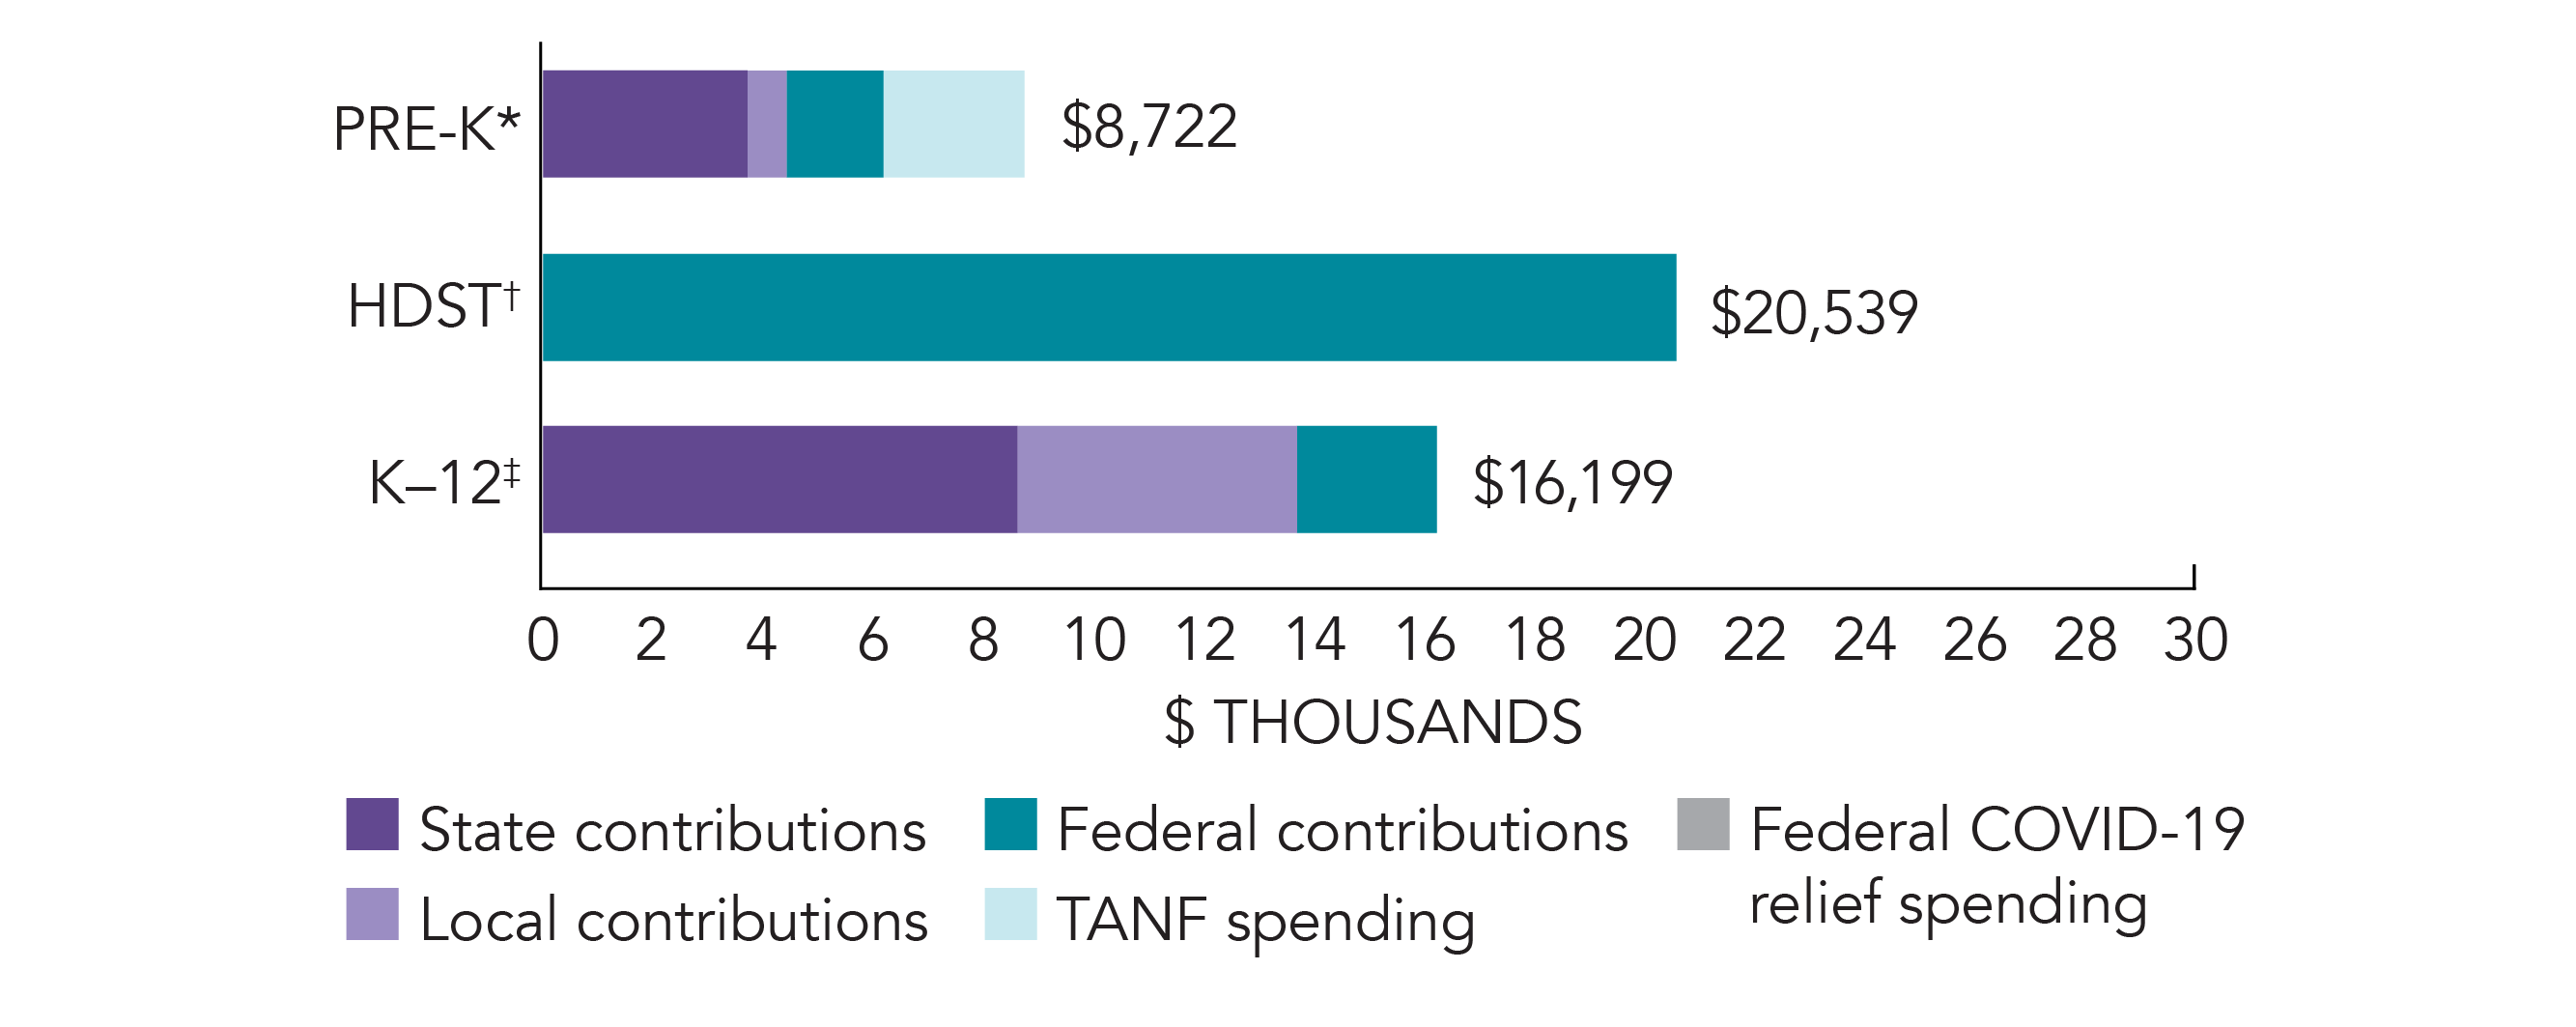
*Pre-K programs may receive additional funds from federal or local sources that are not included in this figure. †Head Start per-child spending includes funding only for 3- and 4-year-olds. ‡K–12 expenditures include capital spending as well as current operating expenditures.
North Carolina Quality Standards Checklist
| Policy | Requirement | Benchmark | Meets Benchmark? |
|---|---|---|---|
For more information about the benchmarks, see the Executive Summary and the Roadmap to State pages. | 9*benchmarks met | ||
| Early Learning & Development Standards Benchmark | Comprehensive, aligned, supported, culturally sensitive | Comprehensive, aligned, supported, culturally sensitive | |
| Curriculum Supports Benchmark | Approval process & supports | Approval process & supports | |
| Teacher Degree Benchmark | BA* | BA | |
| Teacher Specialized Training Benchmark | ECE, CD | Specializing in pre-K | |
| Assistant Teacher Degree Benchmark | CDA or AA in ECE or CD | CDA or equivalent | |
| Staff Professional Development Benchmark | 5-20 hours/year; PD plans; Coaching | For teachers & assistants: At least 15 hours/year; individual PD plans; coaching | |
| Maximum Class Size Benchmark | 20 (4-year-olds) | 20 or lower | |
| Staff to Child Ratio Benchmark | 1:10 (4-year-olds) | 1:10 or better | |
| Screening & Referral Benchmark | Vision, hearing, health & more | Vision, hearing & health screenings; & referral | |
| Continuous Quality Improvement System Benchmark | Structured classroom observations; Data used for program improvement | Structured classroom observations; data used for program improvement | |
* Indicates that while policy meets the benchmark, it is not being implemented fully