State of Preschool
Massachusetts
Access Rankings
4-year-Olds
25
3-year-Olds
10
Resource Rankings
State spending
43
All reported spending
34
Total Benchmarks Met
Of 10 benchmarks possible
5.2
Overview
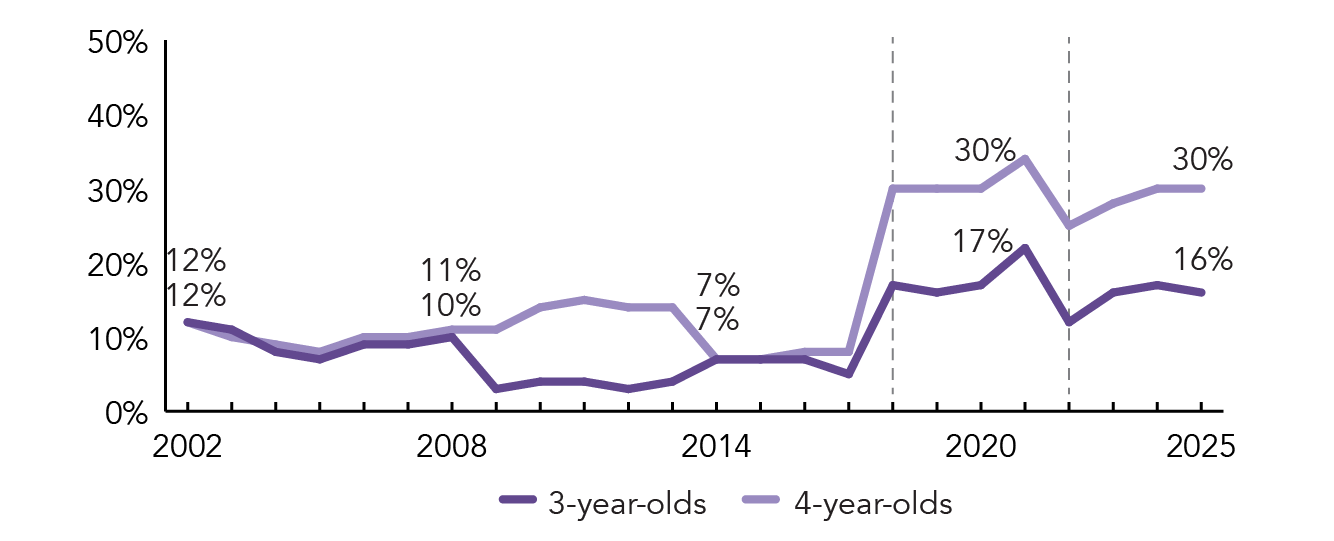
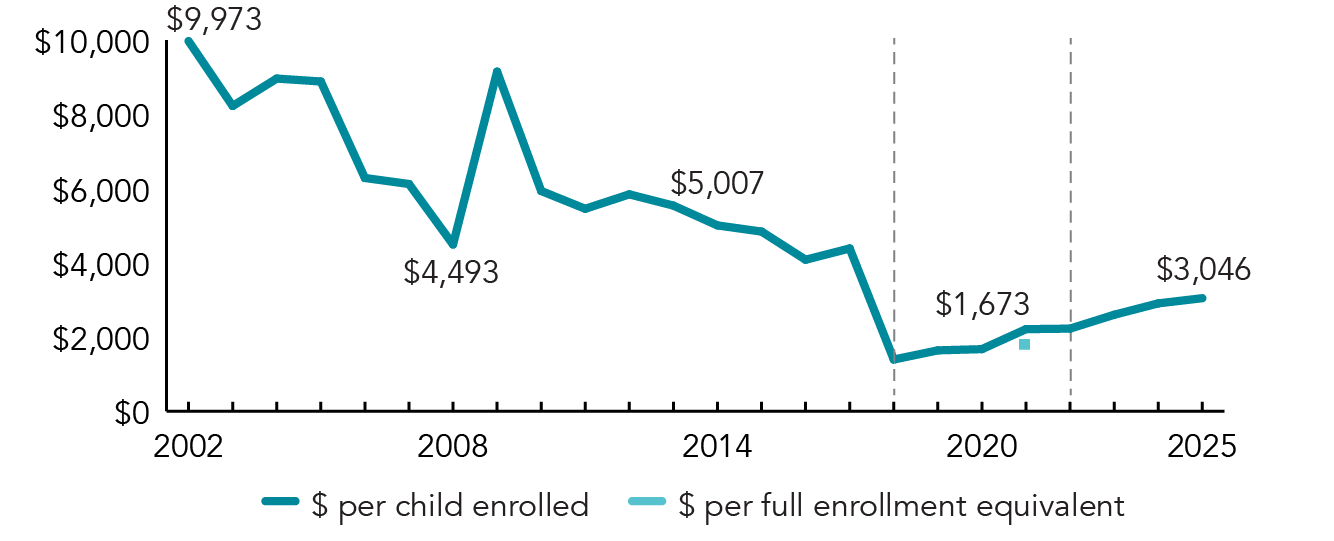
During the 2024-2025 school year, Massachusetts preschool programs enrolled 34,707 children in 2024-2025, a decrease of 447 children from the prior year. State spending totaled $105,715,076, up $3,562,184 (3%), adjusted for inflation, since last year. State spending per child equaled $3,046 in 2024-2025, up $140 from 2023-2024, adjusted for inflation. Massachusetts met an average of 5.2 of 10 quality standards benchmarks.
Changes in the preschool programs operated by the Department of Early Education and Care in 2018 and 2022 are noted by vertical lines on the above enrollment and spending figures.
What's New
Massachusetts level-funded the Commonwealth Preschool Partnership Initiative (CPPI) grant program between FY24 and FY25 and again in FY26, maintaining support for existing communities but limiting expansion to new planning grantees. Despite flat funding, CPPI grantees collectively added 20 classrooms under the program umbrella in FY25, reflecting continued local efforts to expand preschool access within current funding constraints. CPPI also continued to receive policy support through the Governor’s Gateway to Pre-K initiative.
In addition, the legislature sustained substantial state investment in provider stability through the Commonwealth Cares for Children (C3) Operational Grants. The state maintained a $475 million annual commitment in FY25 to support early education and care providers, helping stabilize operations and staffing across the mixed-delivery system even as new preschool expansion opportunities remained limited.
A new round of PDG B–5 Systems Building Grants were awarded to support states in building systems and strengthening their ECE programs that expand parental choice in a mixed-delivery system, improve system efficiency and collaboration, and raise the overall quality of programs. Massachusetts received $11,971,330 in this most recent round of funding.
Background
In 2005, Massachusetts established the Department of Early Education and Care (EEC) which has supported access to high-quality preschool through multiple grant programs. These include a Universal Pre-Kindergarten (UPK) grant to support quality, affordability, and accessibility available to licensed programs serving 3- and 4-year-olds until 2019. The Inclusive Preschool Learning Environments (IPLE) Grant was available to programs until 2019 and was designed to support access for preschool-age children with and without disabilities to high quality, inclusive early education and care settings. These programs are no longer included in the report.
In 2019, EEC launched its Commonwealth Preschool Partnerships Initiative (CPPI), which supports high quality preschool access for children from age 3 until they reach the locally determined kindergarten eligibility age. State funding is awarded directly to public school districts that serve as the fiscal and programmatic managers of the grant. Funded school districts are required to subcontract with community-based early education and care programs from their communities to implement the grant requirements, providing preschool access across public and private classrooms.
Massachusetts also supports preschool enrollment through the Chapter 70 funding stream, the state’s funding formula for PK–12 public schools. All children in the state are eligible for the program and are served in public school settings, but local districts can set their own eligibility priorities. Lead teachers are required to have at least a bachelor’s degree and a Preschool through Grade 2 license.
-
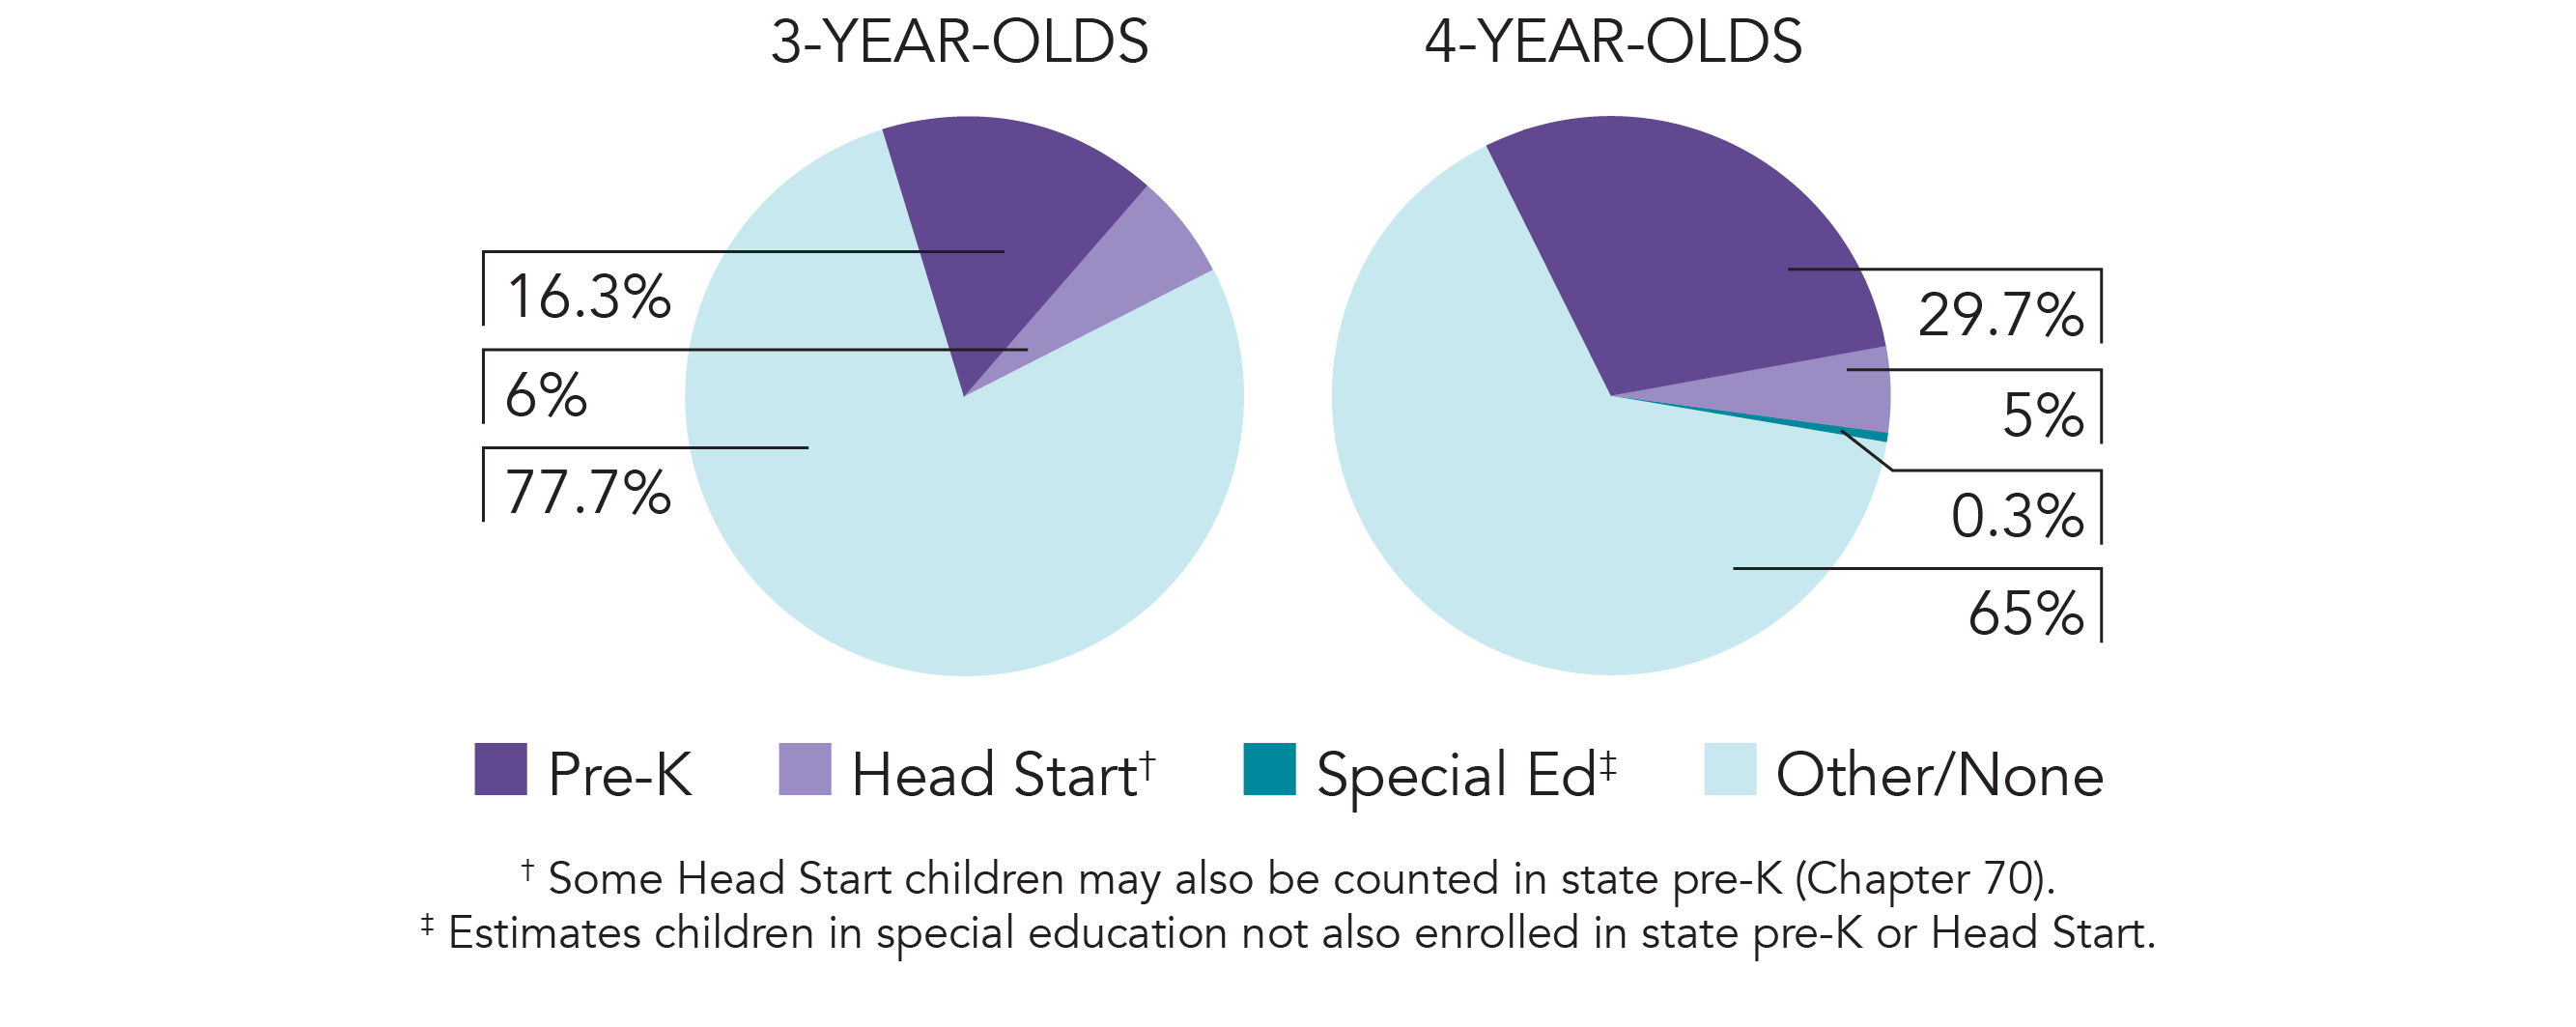
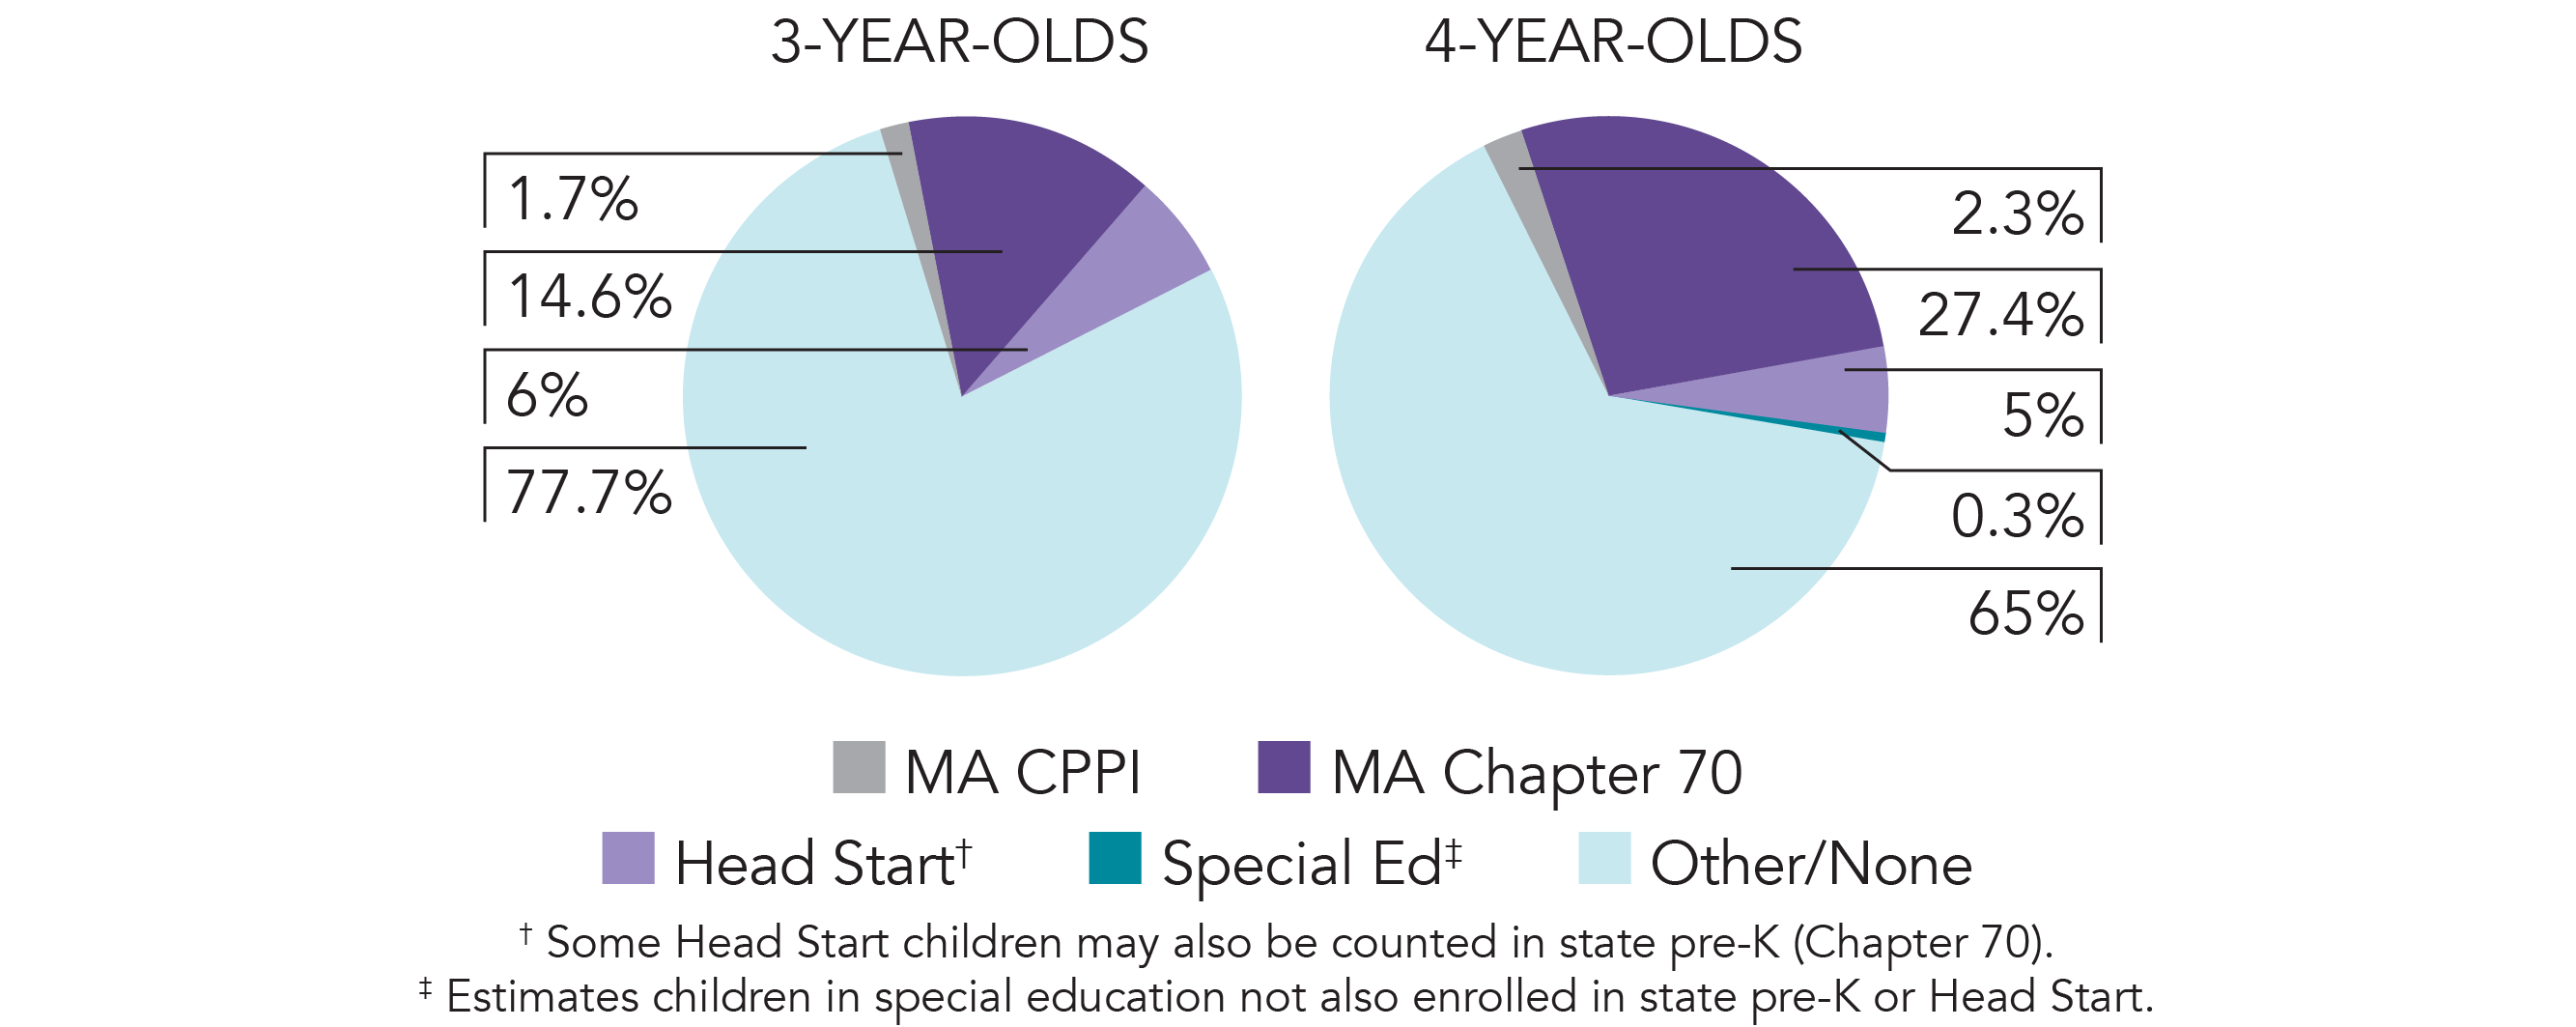
Access

Total state pre-K enrollment 34,707 Special education enrollment, ages 3 and 4 11,725 Federally funded Head Start enrollment, ages 3 and 4 7,551 State-funded Head Start enrollment, ages 3 and 4 0 Resources
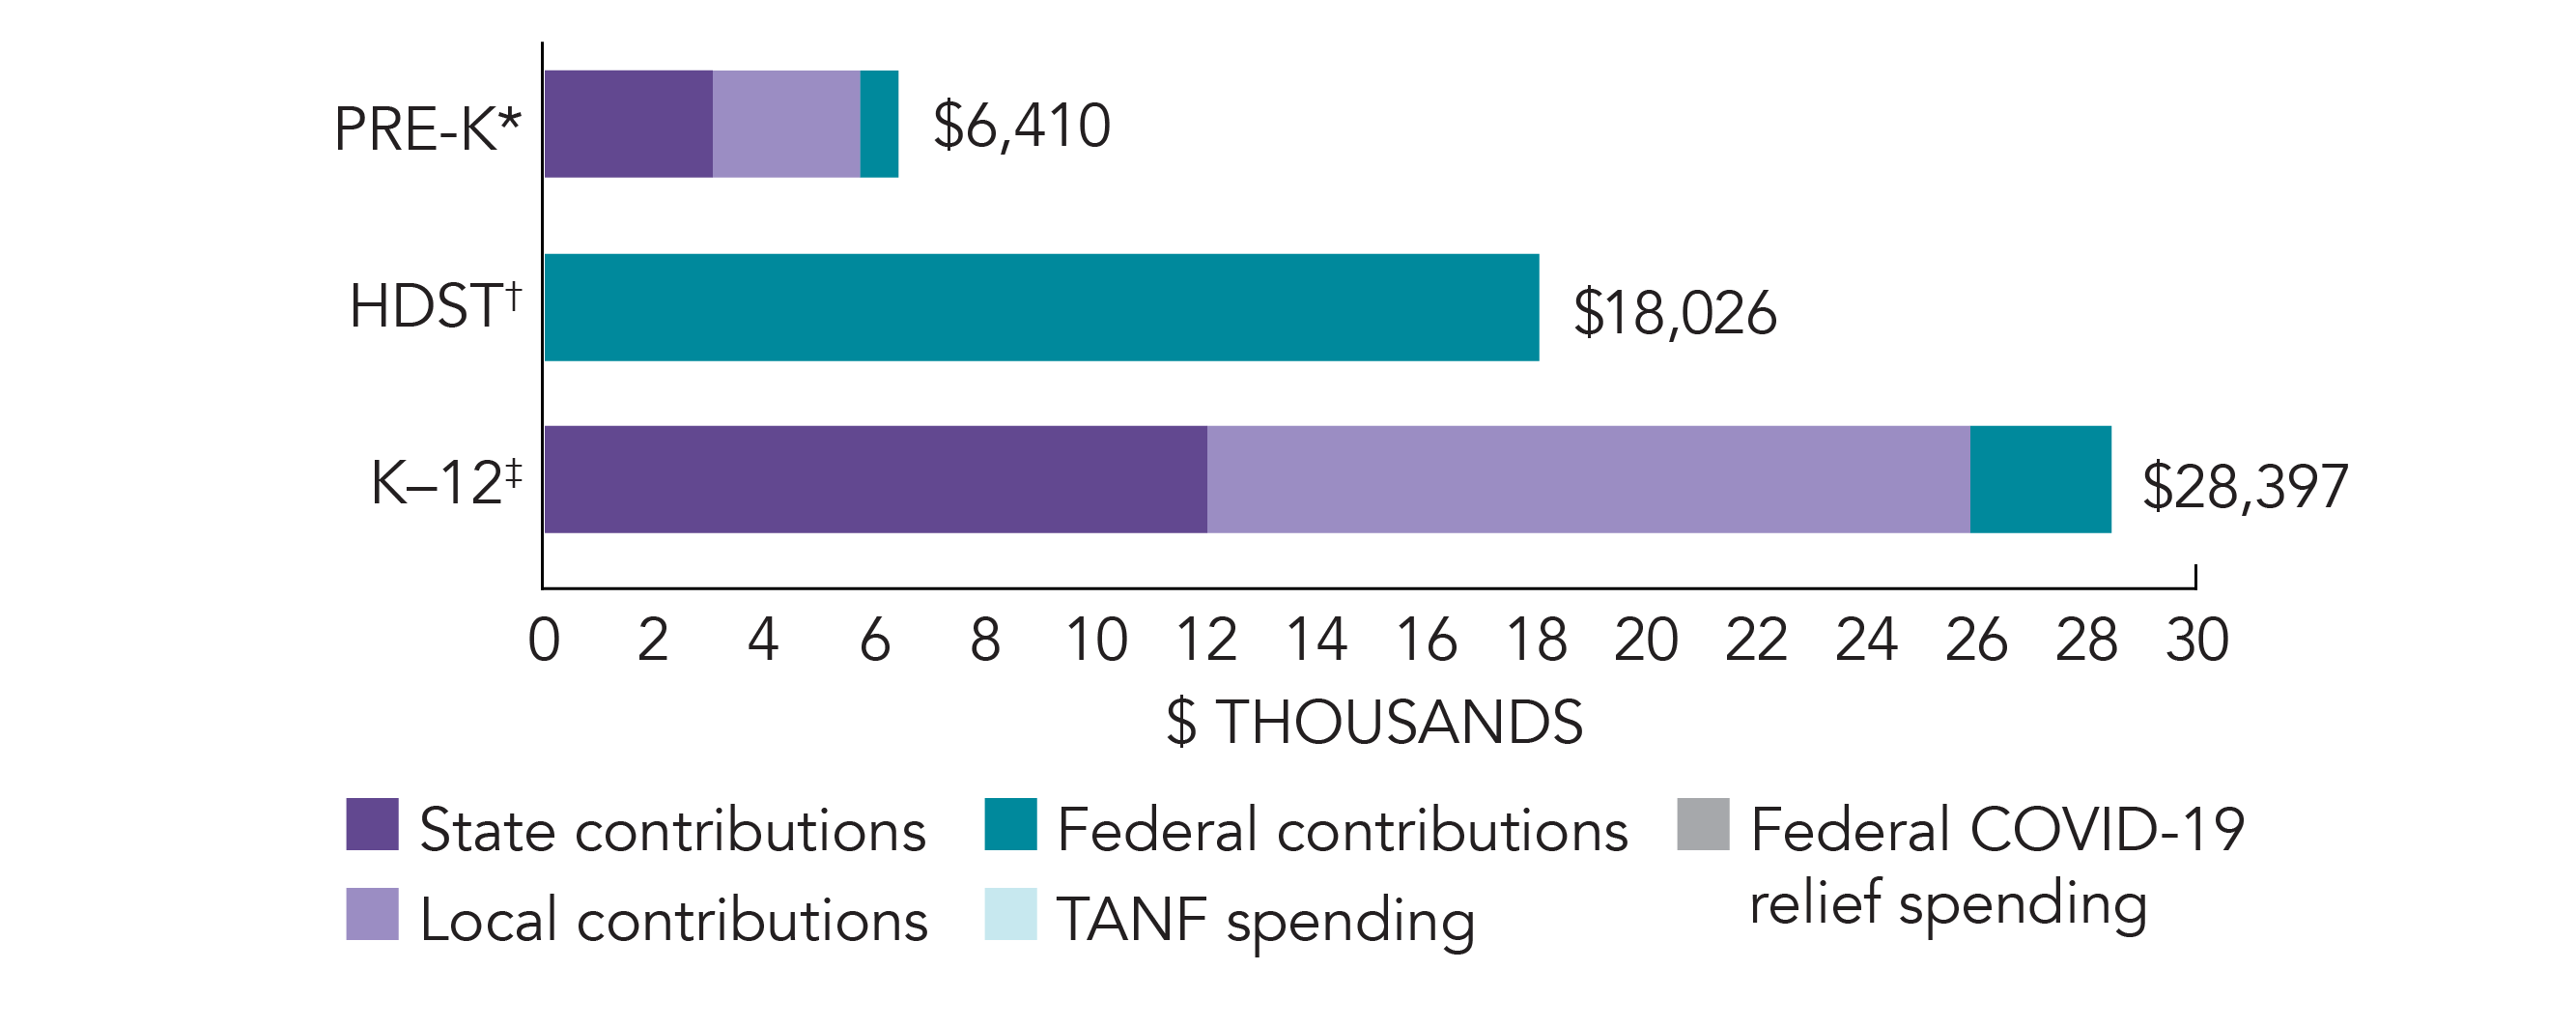
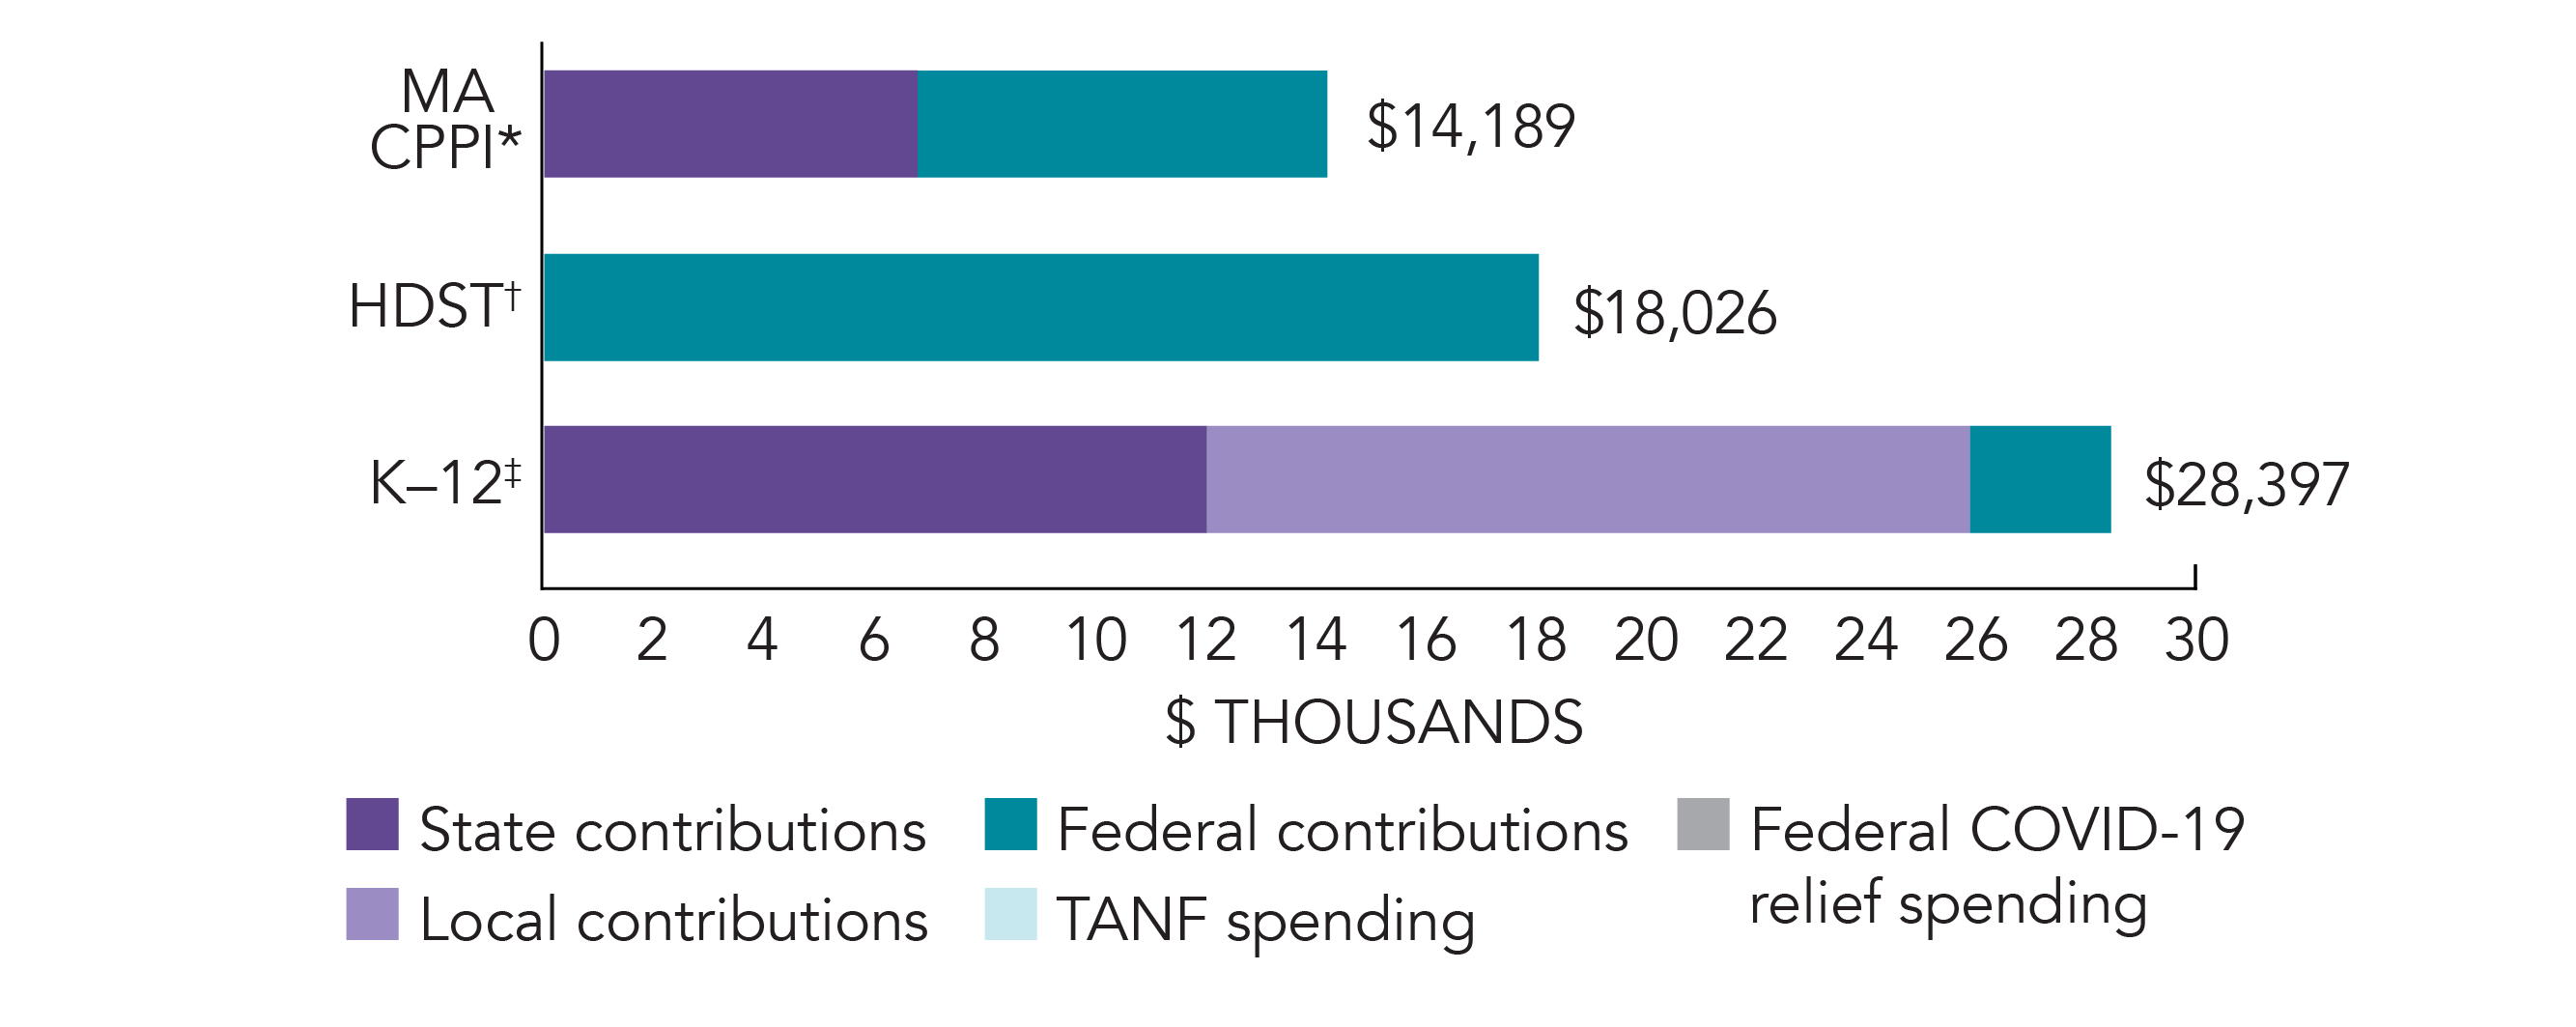
Total state pre-K spending $105,715,076 State Head Start spending $18,500,000 State spending per child enrolled $3,046 All reported spending per child enrolled* $6,410 
*Pre-K programs may receive additional funds from federal or local sources that are not included in this figure. †Head Start per-child spending includes funding only for 3- and 4-year-olds. ‡K–12 expenditures include capital spending as well as current operating expenditures.
-
Access

Total state pre-K enrollment 3,249 School districts that offer state program 6% (towns/communities) Income requirement Determined locally Minimum hours of operation 6 hours/day; 5 days/week Operating schedule Determined locally Resources
Total state pre-K spending $21,966,339 Local match required? No State Head Start spending $18,500,000 State spending per child enrolled $6,761 All reported spending per child enrolled* $14,189 
*Pre-K programs may receive additional funds from federal or local sources that are not included in this figure. †Head Start per-child spending includes funding only for 3- and 4-year-olds. ‡K–12 expenditures include capital spending as well as current operating expenditures.
Massachusetts Commonwealth Preschool Partnerships Initiative Quality Standards Checklist
| Policy | MA CPPI Requirement | Benchmark | Meets Benchmark? |
|---|---|---|---|
For more information about the benchmarks, see the Executive Summary and the Roadmap to State pages. | 7benchmarks met | ||
| Early Learning & Development Standards Benchmark | Comprehensive, aligned, supported, culturally sensitive | Comprehensive, aligned, supported, culturally sensitive | |
| Curriculum Supports Benchmark | Approval process & supports | Approval process & supports | |
| Teacher Degree Benchmark | BA (public); Other (nonpublic) | BA | |
| Teacher Specialized Training Benchmark | Pre-K - 2 (public); 12 college credits in ECE (nonpublic) | Specializing in pre-K | |
| Assistant Teacher Degree Benchmark | HSD | CDA or equivalent | |
| Staff Professional Development Benchmark | 150 Professional Development Points/5 years (public teachers); 20 hours/year (nonpublic teachers & assistants); PD plans (teachers & nonpublic assistants) | For teachers & assistants: At least 15 hours/year; individual PD plans; coaching | |
| Maximum Class Size Benchmark | 20 (3- & 4-year-olds) | 20 or lower | |
| Staff to Child Ratio Benchmark | 1:10 (3- & 4-year-olds) | 1:10 or better | |
| Screening & Referral Benchmark | Vision, hearing, health & more | Vision, hearing & health screenings; & referral | |
| Continuous Quality Improvement System Benchmark | Structured classroom observations; Data used for program improvement | Structured classroom observations; data used for program improvement | |
-
Access
Total state pre-K enrollment 31,458 School districts that offer state program 100% Income requirement No income requirement Minimum hours of operation Determined locally Operating schedule Determined locally Resources
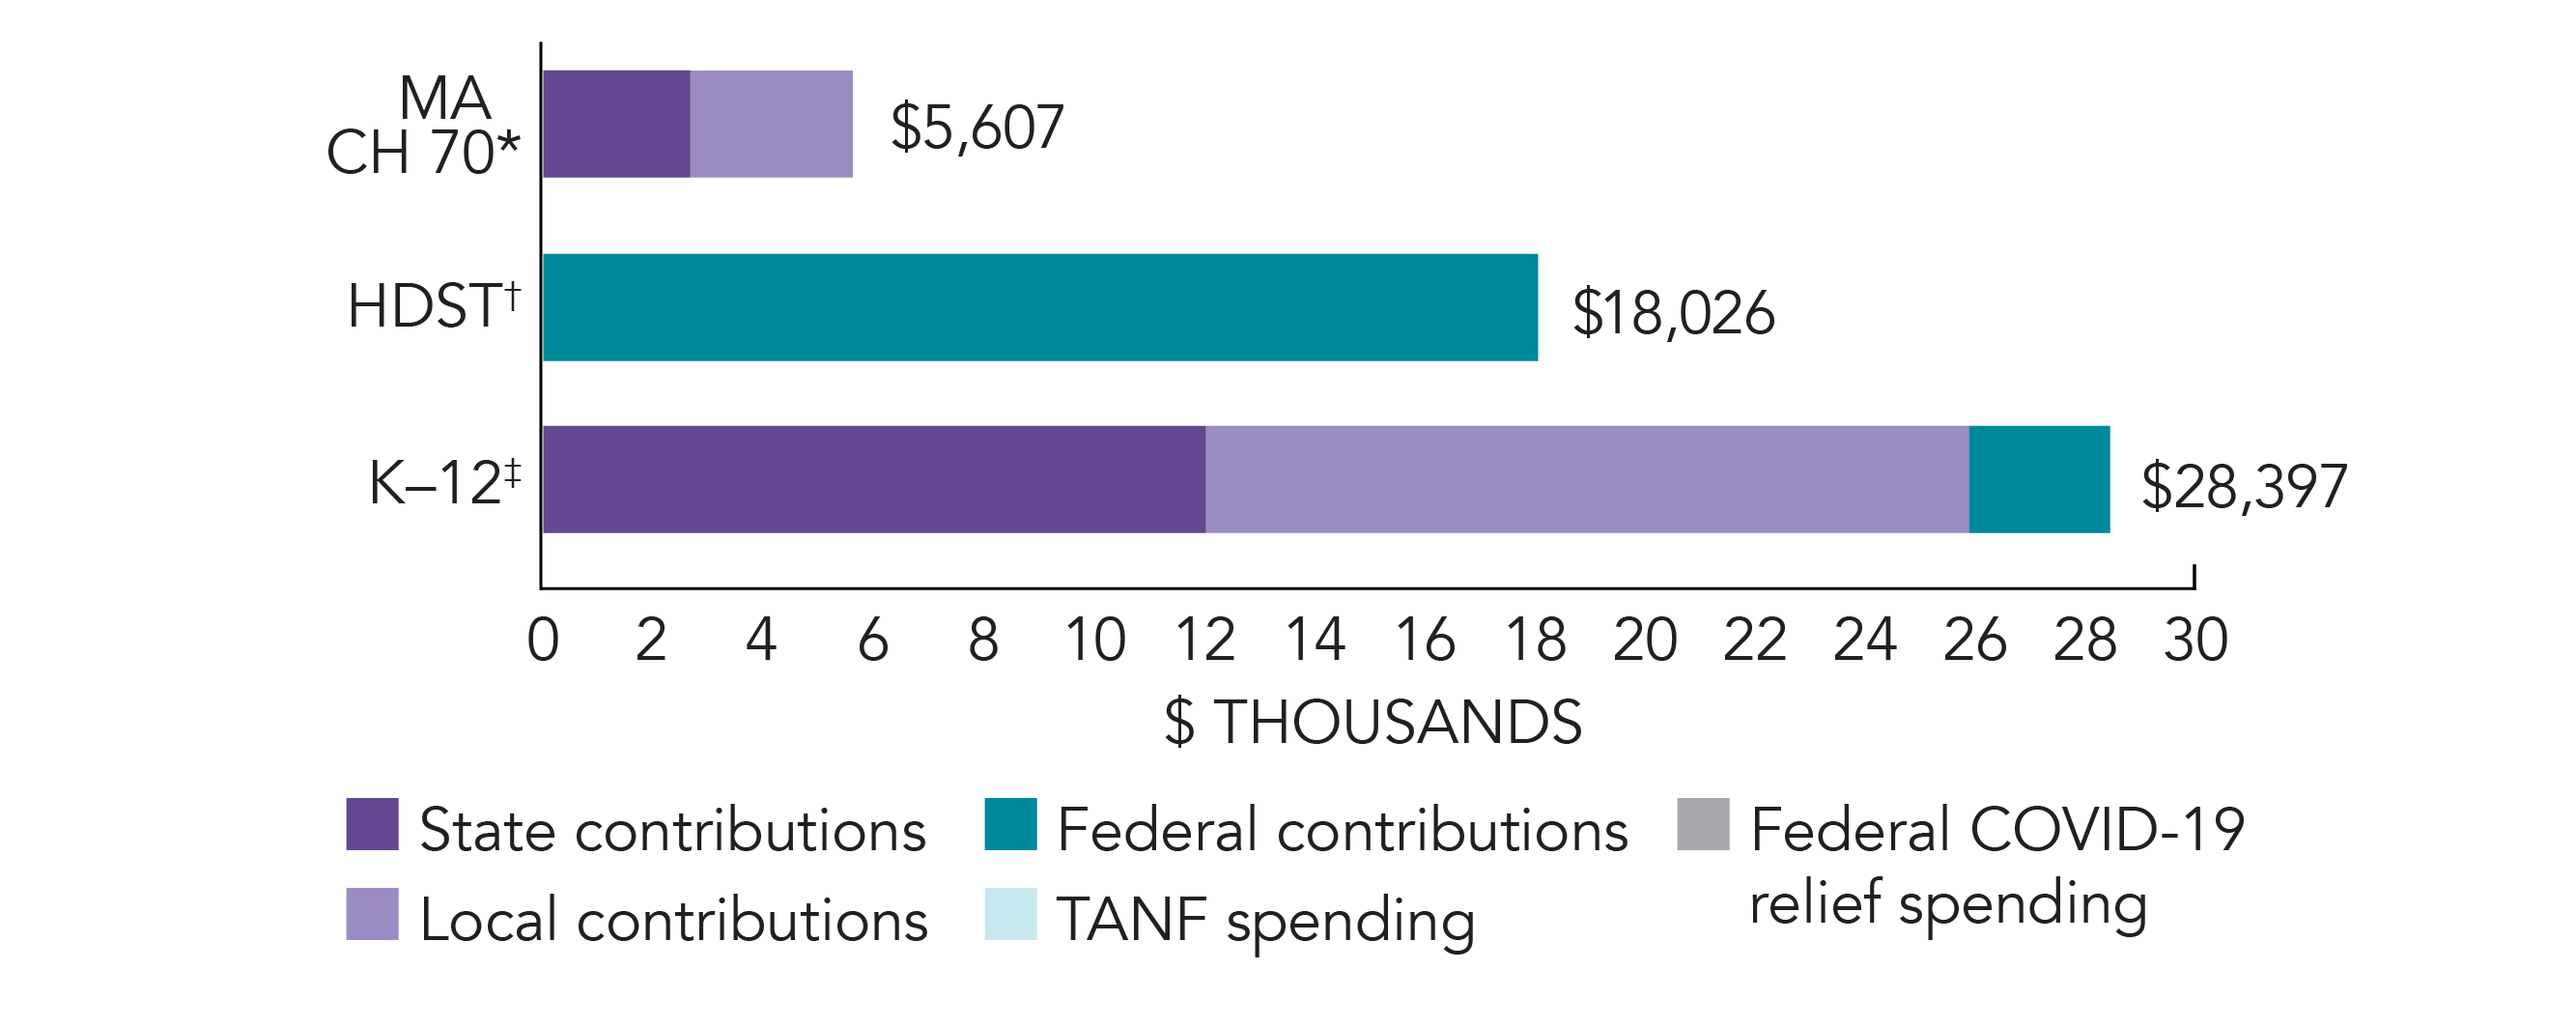
Total state pre-K spending $83,748,737 Local match required? Yes State Head Start spending $18,500,000 State spending per child enrolled $2,662 All reported spending per child enrolled* $5,607 
*Pre-K programs may receive additional funds from federal or local sources that are not included in this figure. †Head Start per-child spending includes funding only for 3- and 4-year-olds. ‡K–12 expenditures include capital spending as well as current operating expenditures.
Massachusetts Chapter 70 Quality Standards Checklist
| Policy | MA Chapter 70 Requirement | Benchmark | Meets Benchmark? |
|---|---|---|---|
For more information about the benchmarks, see the Executive Summary and the Roadmap to State pages. | 5benchmarks met | ||
| Early Learning & Development Standards Benchmark | Comprehensive, aligned, supported, culturally sensitive | Comprehensive, aligned, supported, culturally sensitive | |
| Curriculum Supports Benchmark | Approval process & supports | Approval process & supports | |
| Teacher Degree Benchmark | BA | BA | |
| Teacher Specialized Training Benchmark | Pre-K - 2 | Specializing in pre-K | |
| Assistant Teacher Degree Benchmark | Determined locally | CDA or equivalent | |
| Staff Professional Development Benchmark | 150 Professional Development Points/5 years (teachers only); PD plans (teachers only) | For teachers & assistants: At least 15 hours/year; individual PD plans; coaching | |
| Maximum Class Size Benchmark | No limit (3- & 4-year-olds) | 20 or lower | |
| Staff to Child Ratio Benchmark | No limit (3- & 4-year-olds) | 1:10 or better | |
| Screening & Referral Benchmark | Vision, hearing, health & more | Vision, hearing & health screenings; & referral | |
| Continuous Quality Improvement System Benchmark | Determined locally | Structured classroom observations; data used for program improvement | |