State of Preschool
Maryland
Access Rankings
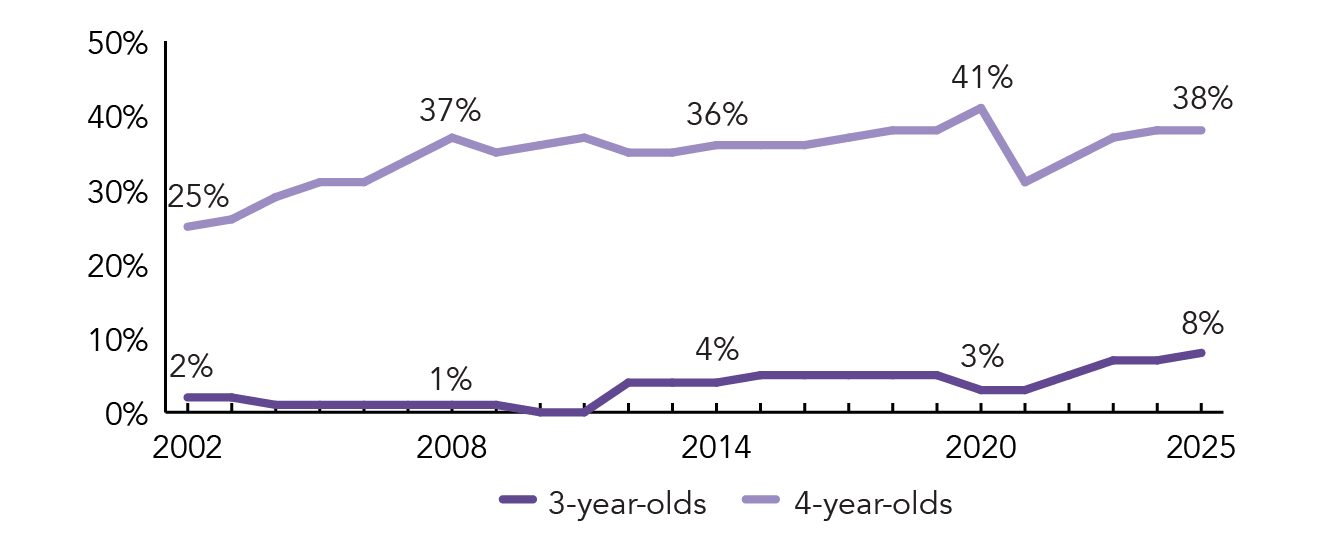
4-year-Olds
19
3-year-Olds
18
Resource Rankings
State spending
17
All reported spending
15
Total Benchmarks Met
Of 10 benchmarks possible
7
Overview
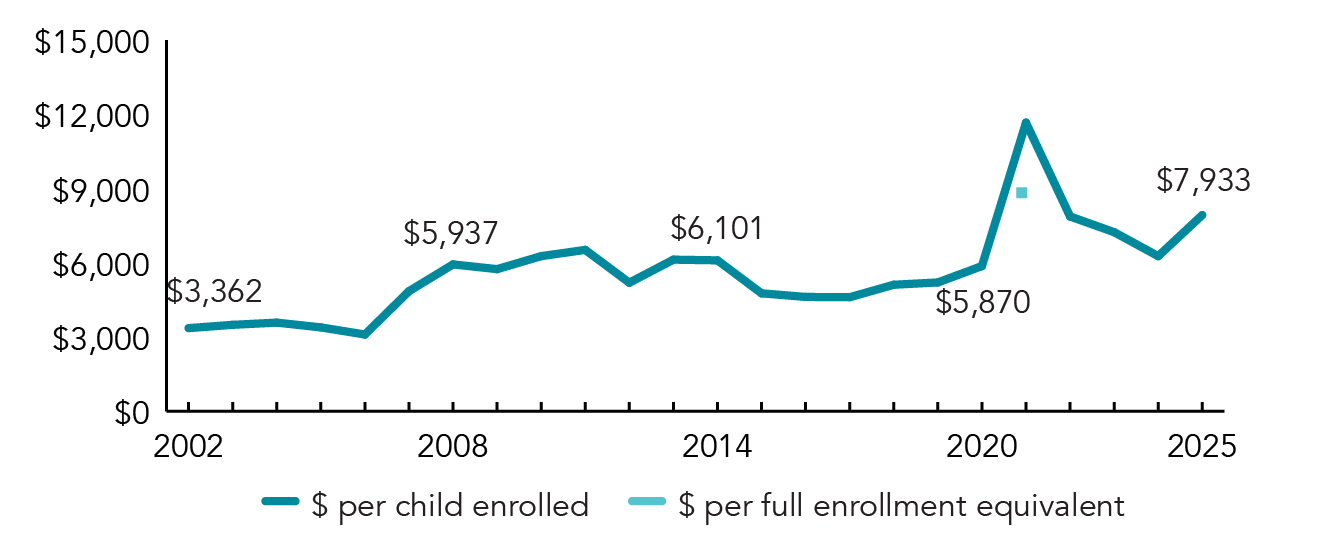
During the 2024-2025 school year, Maryland preschool enrolled 34,003 children, an increase of 1,031 from the prior year. State spending totaled $269,734,230, up $62,963,083 (30%), adjusted for inflation, since last year. State spending per child equaled $7,933 in 2024-2025, up $1,662 from 2023-2024, adjusted for inflation. Maryland met 7 of 10 quality standards benchmarks.
What's New
Maryland continued implementation of the Blueprint for Maryland’s Future, with the Maryland State Department of Education (MSDE) issuing ongoing guidance to support expansion and quality improvement, including a goal that at least 50% of new pre-K slots be delivered by private providers by 2028–29. The phase-out of federal COVID-relief funding increased pressure on local budgets that indirectly support pre-K expansion.
Legislative and budget actions in 2024–2025 focused on workforce stability, financing, and system design. HB 1441 established an experience-based pathway for lead teachers, created an Early Childhood Educator Career Ladder for eligible private providers, authorized facilities leasing funds, and required a model memorandum of understanding to support school–provider partnerships. Maryland increased the pre-K per-pupil amount in FY 2026, while preserving Blueprint-related pre-K funding after the General Assembly rejected proposed slowdowns. MSDE also continued Pre-K Expansion Grants, launched a Pre-K Systems Analysis Workgroup to assess the mixed-delivery system, implemented a licensed outdoor, nature-based preschool pilot, and moved toward a statewide $60,000 minimum teacher salary effective July 1, 2026.
A new round of PDG B–5 Systems Building Grants were awarded to support states in building systems and strengthening their ECE programs that expand parental choice in a mixed-delivery system, improve system efficiency and collaboration, and raise the overall quality of programs. Maryland received $14,751,000 to conduct a statewide needs assessment, unify workforce pathways through a Career Lattice, launch a centralized Pre-K enrollment portal, enhance family search tools, expand program availability through Shared Service Hubs, and integrate evidence-based instructional tools, and modernize operational systems with features like background check portability, an improved licensing portal, and user-centered design.
Background
Maryland created the Extended Elementary Education Program (EEEP) in 1980 as a pilot preschool program in Baltimore City and Prince George’s County. The Maryland Prekindergarten Program was started in 2002, giving local boards of education until 2007 to provide pre-K in public schools to all 4-year-olds from families with incomes at or below 185% FPL. Maryland enacted the Prekindergarten Expansion Act in 2014, adding $4.3 million per year to increase access to full-day public pre-K for 4-year-olds from families with household incomes up to 300% FPL.
Funding for the Maryland Prekindergarten Program is provided through a school funding formula and is based on the K–12 per pupil amount, to support eligible children attending half-day programs. Division of Early Childhood staff monitor pre-K programs funded through the Prekindergarten Expansion Grants annually, using a self-developed checklist. Prekindergarten Expansion Grantees are required to participate in Maryland EXCELS, the state’s QRIS, and are able to access targeted technical assistance. Maryland also has “Judy Centers” located in Title 1 schools that work collaboratively with elementary schools and community-based providers to offer comprehensive, year-round early learning services for children birth to age five.
Maryland Prekindergarten Program
Access
| |
| Total state pre-K enrollment | 34,003 |
| School districts that offer state program | 100% |
| Income requirement | 185% FPL (part-day); 300% FPL (full-day) |
| Minimum hours of operation | 2.5 hours/day; 5 days/week |
| Operating schedule | School or academic year |
| Special education enrollment, ages 3 and 4 | 11,529 |
| Federally funded Head Start enrollment, ages 3 and 4 | 4,644 |
| State-funded Head Start enrollment, ages 3 and 4 | 0 |
Resources
| Total state pre-K spending | $269,734,230 |
| Local match required? | No |
| State Head Start spending | $2,440,960 |
| State spending per child enrolled | $7,933 |
| All reported spending per child enrolled* | $11,899 |
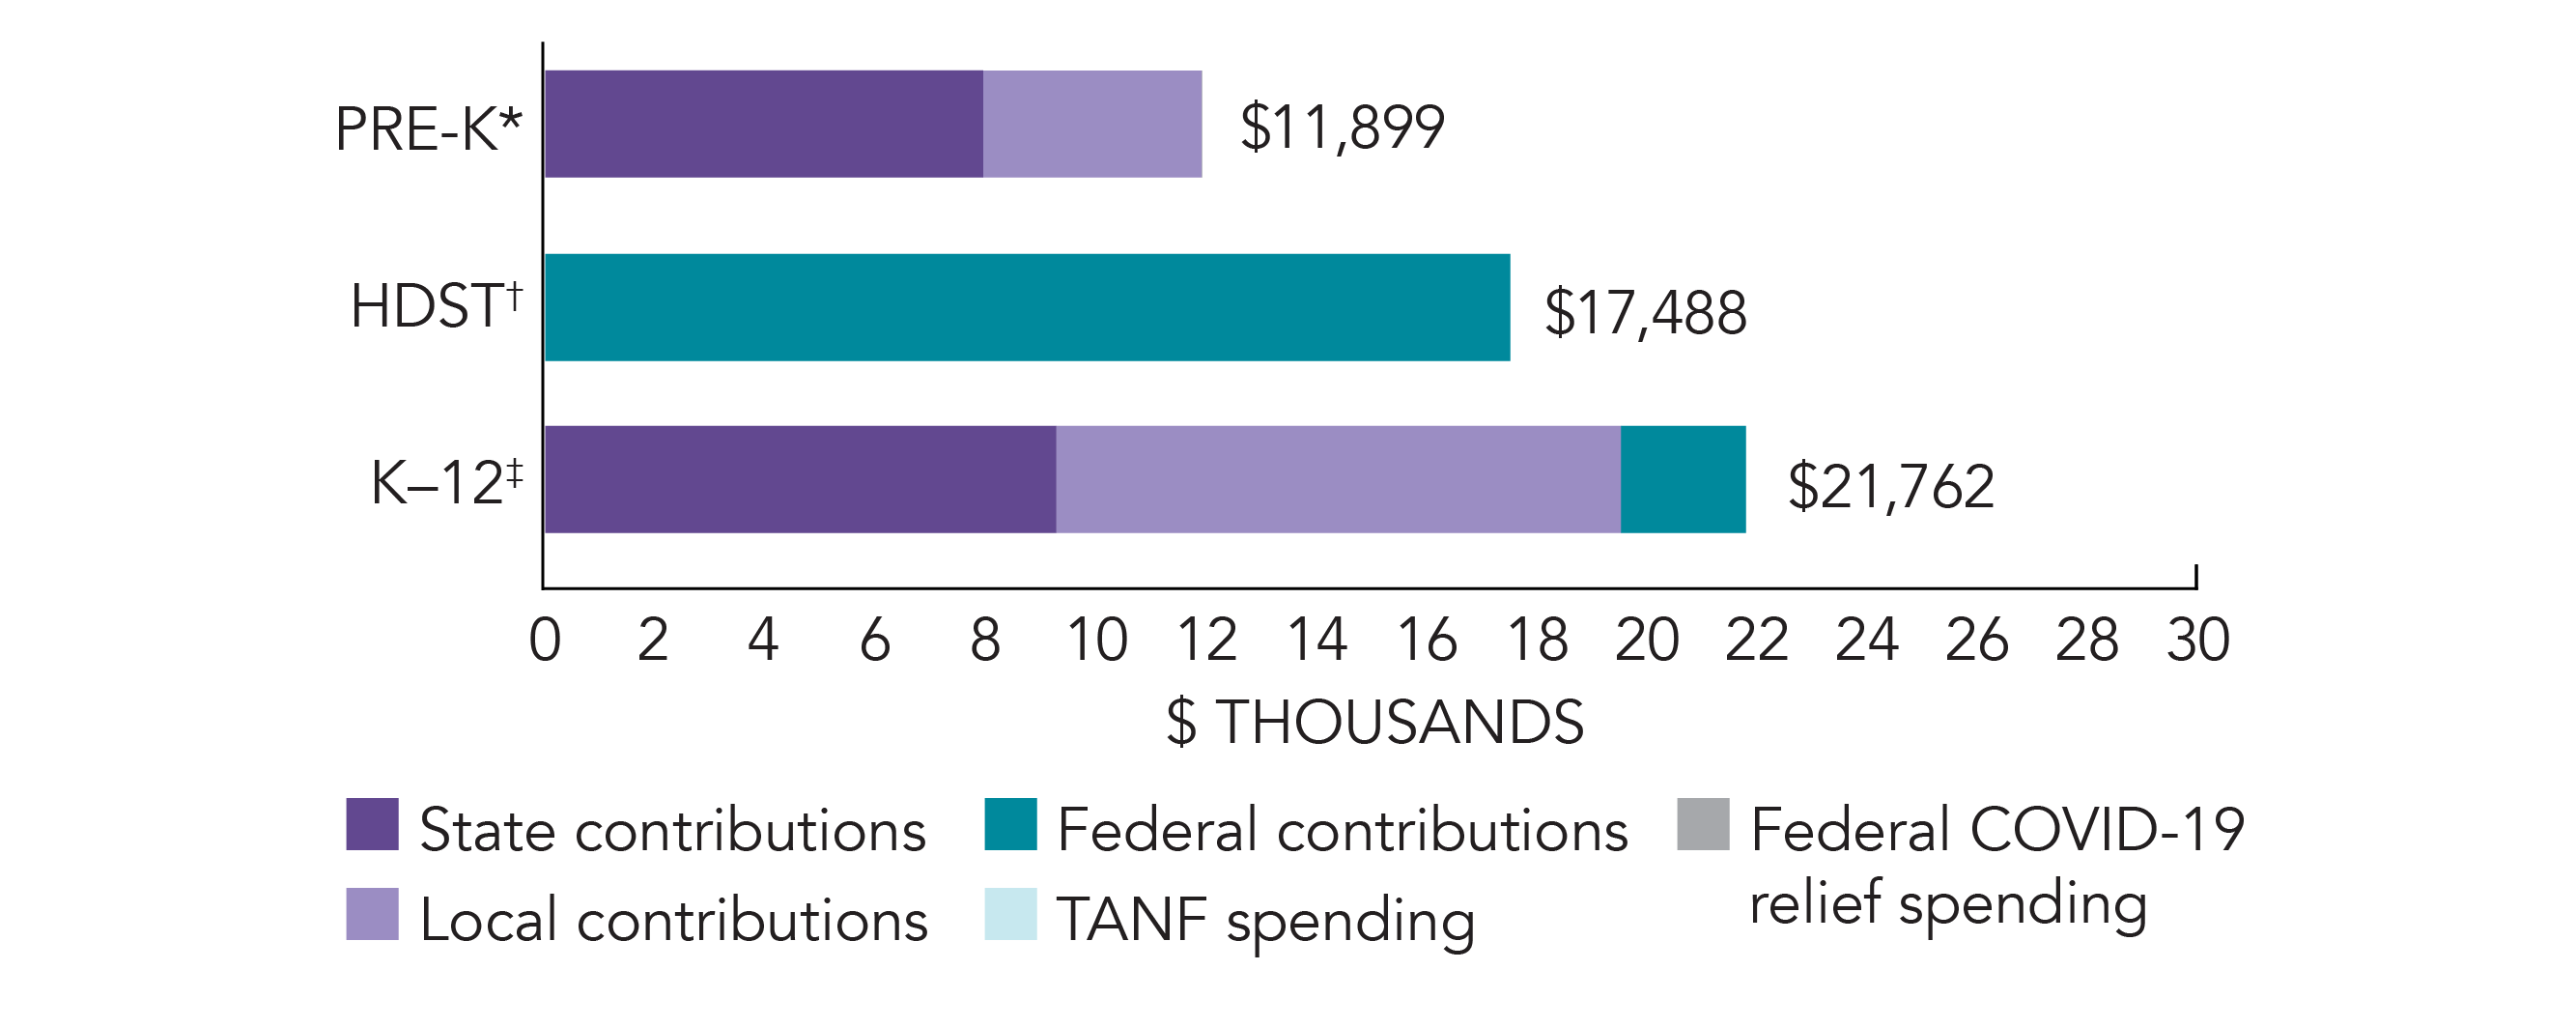
*Pre-K programs may receive additional funds from federal or local sources that are not included in this figure. †Head Start per-child spending includes funding only for 3- and 4-year-olds. ‡K–12 expenditures include capital spending as well as current operating expenditures.
Maryland Quality Standards Checklist
| Policy | Requirement | Benchmark | Meets Benchmark? |
|---|---|---|---|
For more information about the benchmarks, see the Executive Summary and the Roadmap to State pages. | 7benchmarks met | ||
| Early Learning & Development Standards Benchmark | Comprehensive, aligned, supported, culturally sensitive | Comprehensive, aligned, supported, culturally sensitive | |
| Curriculum Supports Benchmark | Approval process & supports | Approval process & supports | |
| Teacher Degree Benchmark | BA | BA | |
| Teacher Specialized Training Benchmark | ECE | Specializing in pre-K | |
| Assistant Teacher Degree Benchmark | HSD | CDA or equivalent | |
| Staff Professional Development Benchmark | 6 credit hours/5 years (public teachers); 24 hours/year (public assistants); 20 clock hours/year (nonpublic teachers and assistants) | For teachers & assistants: At least 15 hours/year; individual PD plans; coaching | |
| Maximum Class Size Benchmark | 20 (3- & 4-year-olds) | 20 or lower | |
| Staff to Child Ratio Benchmark | 1:10 (3- & 4-year-olds) | 1:10 or better | |
| Screening & Referral Benchmark | Vision, hearing, health & more | Vision, hearing & health screenings; & referral | |
| Continuous Quality Improvement System Benchmark | Structured classroom observations vary by program type; Data used program improvement | Structured classroom observations; data used for program improvement | |