State of Preschool
Kentucky
Access Rankings
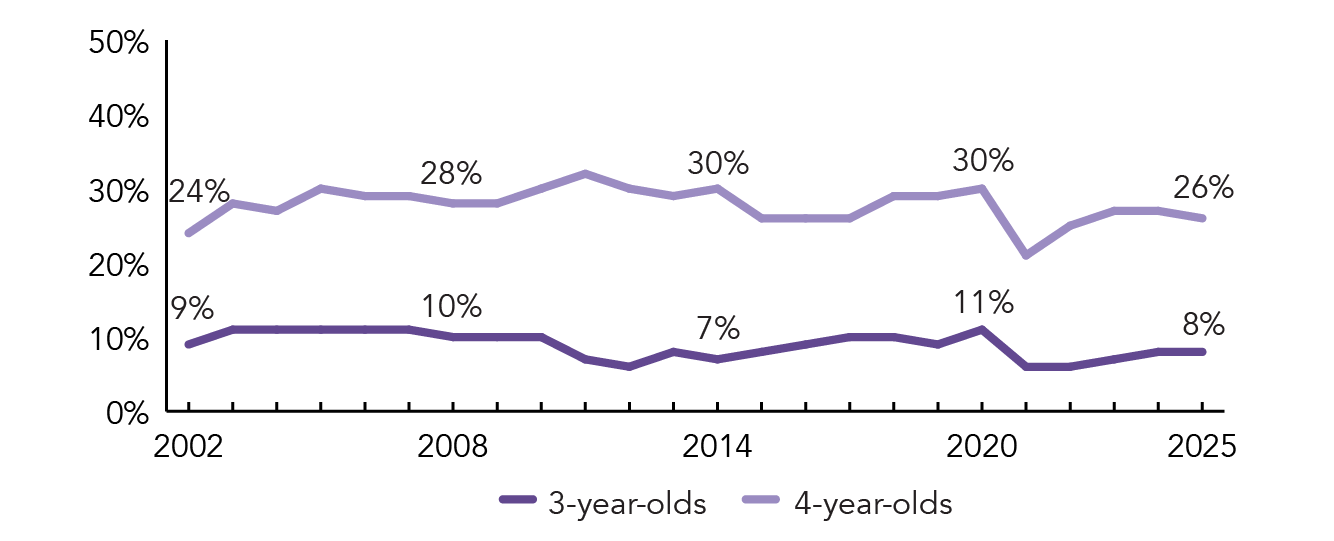
4-year-Olds
28
3-year-Olds
19
Resource Rankings
State spending
33
All reported spending
8
Total Benchmarks Met
Of 10 benchmarks possible
8
Overview
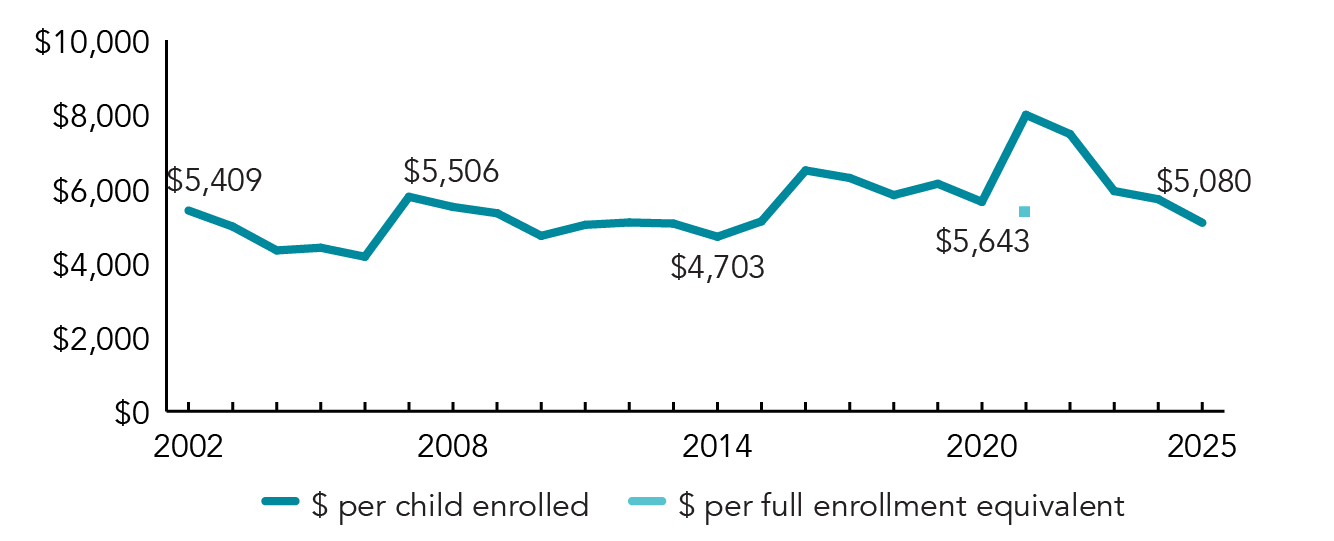
During the 2024-2025 school year, Kentucky preschool enrolled 18,837 children, a decrease of 900 from the prior year. State spending totaled $90,767,593, and an additional $4,924,483 in federal recovery funds supported the program, down $17,082,605 (15%), adjusted for inflation, since last year. State spending per child (including federal recovery funds) equaled $5,080 in 2024-2025, down $634 from 2023-2024, adjusted for inflation. Kentucky met 8 of 10 quality standards benchmarks.
What's New
During the 2024-2025 school year, Kentucky successfully implemented the revised ALL STARS Quality Rating and Improvement System (QRIS). After a pause caused by the COVID-19 pandemic, the state resumed efforts to collect and review data related to the quality of preschool classrooms and programs. This program utilizes the TPOT observation tool and also incorporates components of the Pyramid Model Framework. This framework will encourage districts to implement best practices in classroom management and behavior.
Governor Andy Beshear issued Executive Order 2025-351 in June 2025, which created the Team Kentucky Pre-K for All Advisory Committee, comprised of leaders in education, childcare, workforce development, government, and business. The Pre-K for All Findings and Recommendations Advisory Committee Report was released on October 30, 2025. Based on the report, the Committee recommended that Kentucky expand preschool with an expectation of district-level partnerships, an emphasis on quality, and the establishment of a unified data system.
Background
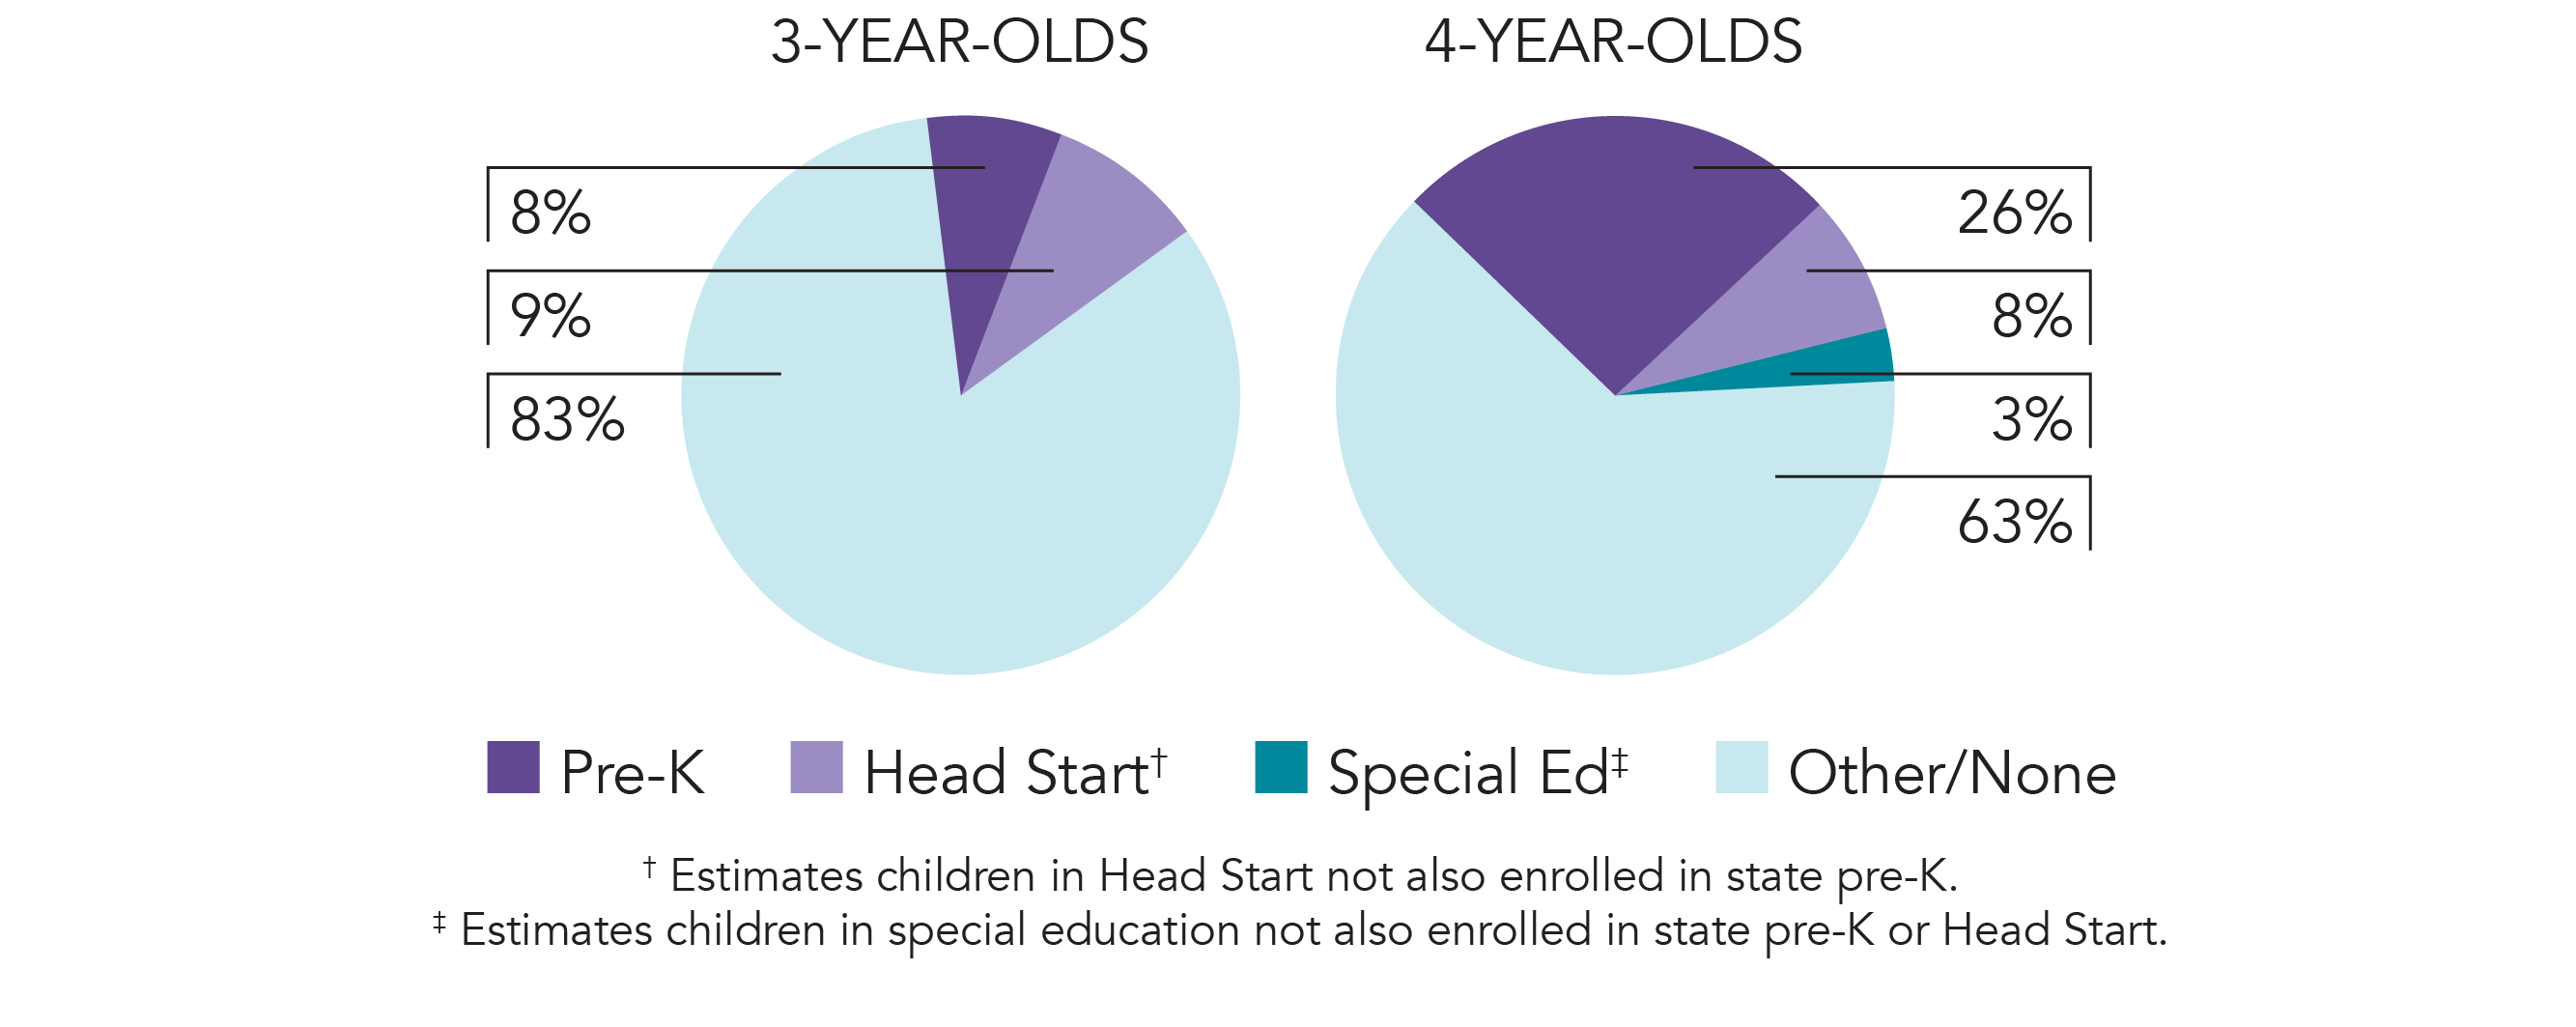
The Kentucky Preschool Program (KPP), launched in 1990, is available to 4-year-olds from low-income families, and 3- and 4-year-olds with disabilities. KPP programs operate half- or full-day, for at least 2.5 hours per day, four or five days per week. Income eligibility increased from 150% to 160% FPL beginning with the 2015-2016 school year. Children who do not meet state eligibility requirements may still participate if there is space, but they are funded either by the school district or tuition, rather than state dollars.
KPP is administered by the Kentucky Department of Education (KDE), Office of Special Education and Early Learning, the Early Learning Unit, School Readiness Branch. Funds are distributed to school districts through a funding formula. School districts may subcontract with private child care centers, Head Start programs, and special education providers to offer preschool services.
Kentucky Preschool Program
Access
| |
| Total state pre-K enrollment | 18,837 |
| School districts that offer state program | 100% |
| Income requirement | 160% FPL |
| Minimum hours of operation | 2.5 hours/day |
| Operating schedule | School or academic year |
| Special education enrollment, ages 3 and 4 | 12,111 |
| Federally funded Head Start enrollment, ages 3 and 4 | 10,012 |
| State-funded Head Start enrollment, ages 3 and 4 | 0 |
Resources
| Total state pre-K spending | $95,692,076 |
| Local match required? | No |
| State Head Start spending | $0 |
| State spending per child enrolled | $5,080 |
| All reported spending per child enrolled* | $13,685 |
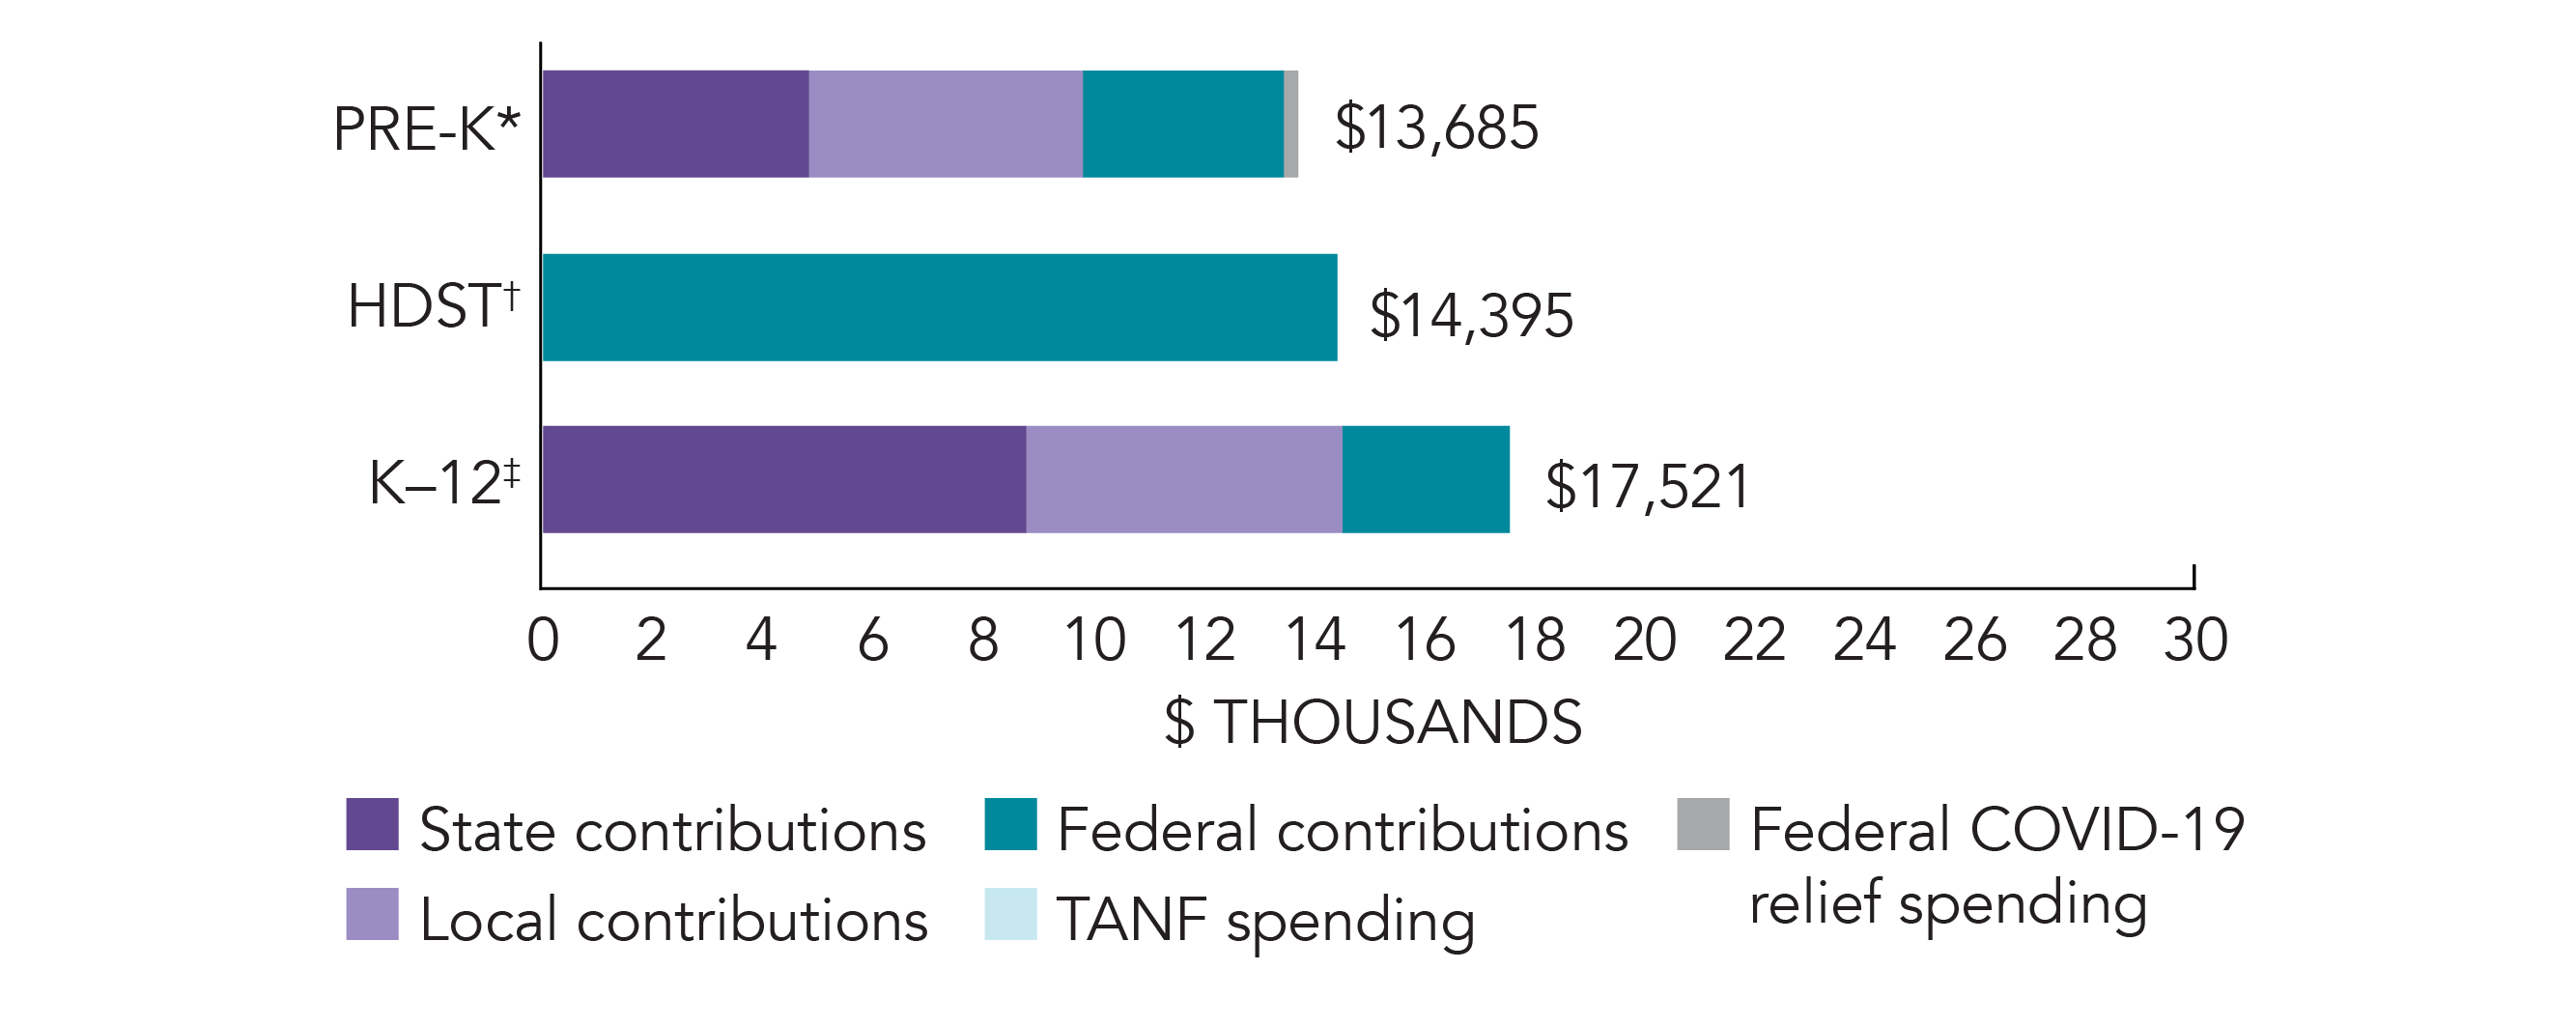
*Pre-K programs may receive additional funds from federal or local sources that are not included in this figure. †Head Start per-child spending includes funding only for 3- and 4-year-olds. ‡K–12 expenditures include capital spending as well as current operating expenditures.
Kentucky Quality Standards Checklist
| Policy | Requirement | Benchmark | Meets Benchmark? |
|---|---|---|---|
For more information about the benchmarks, see the Executive Summary and the Roadmap to State pages. | 8benchmarks met | ||
| Early Learning & Development Standards Benchmark | Comprehensive, aligned, supported, culturally sensitive | Comprehensive, aligned, supported, culturally sensitive | |
| Curriculum Supports Benchmark | Approval process & supports | Approval process & supports | |
| Teacher Degree Benchmark | BA | BA | |
| Teacher Specialized Training Benchmark | ECE, CD, ECE SpEd | Specializing in pre-K | |
| Assistant Teacher Degree Benchmark | HSD or Equivalent | CDA or equivalent | |
| Staff Professional Development Benchmark | 24 hours/year (teachers); 18 hours/year (assistants); PD plans (public teachers only); Coaching (certified teachers) | For teachers & assistants: At least 15 hours/year; individual PD plans; coaching | |
| Maximum Class Size Benchmark | 20 (3- & 4-year-olds) | 20 or lower | |
| Staff to Child Ratio Benchmark | 1:10 (3- & 4-year-olds) | 1:10 or better | |
| Screening & Referral Benchmark | Vision, hearing, health & more | Vision, hearing & health screenings; & referral | |
| Continuous Quality Improvement System Benchmark | Structured classroom observations; Data used for program improvement | Structured classroom observations; data used for program improvement | |