State of Preschool
Kansas
Access Rankings
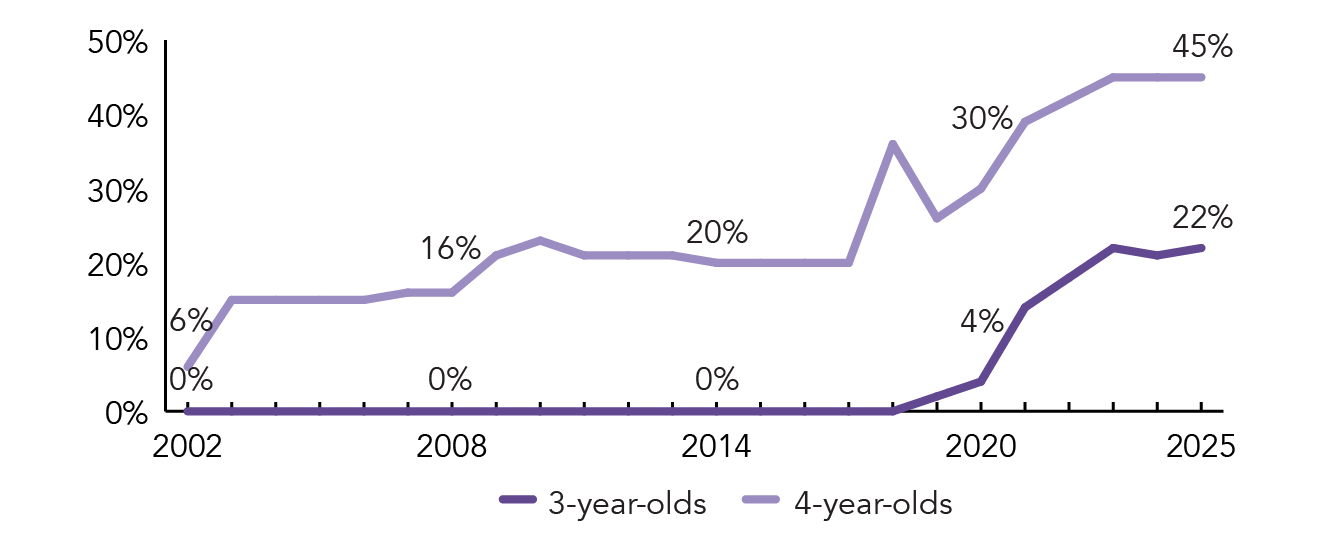
4-year-Olds
16
3-year-Olds
6
Resource Rankings
State spending
36
All reported spending
40
Total Benchmarks Met
Of 10 benchmarks possible
6
Overview
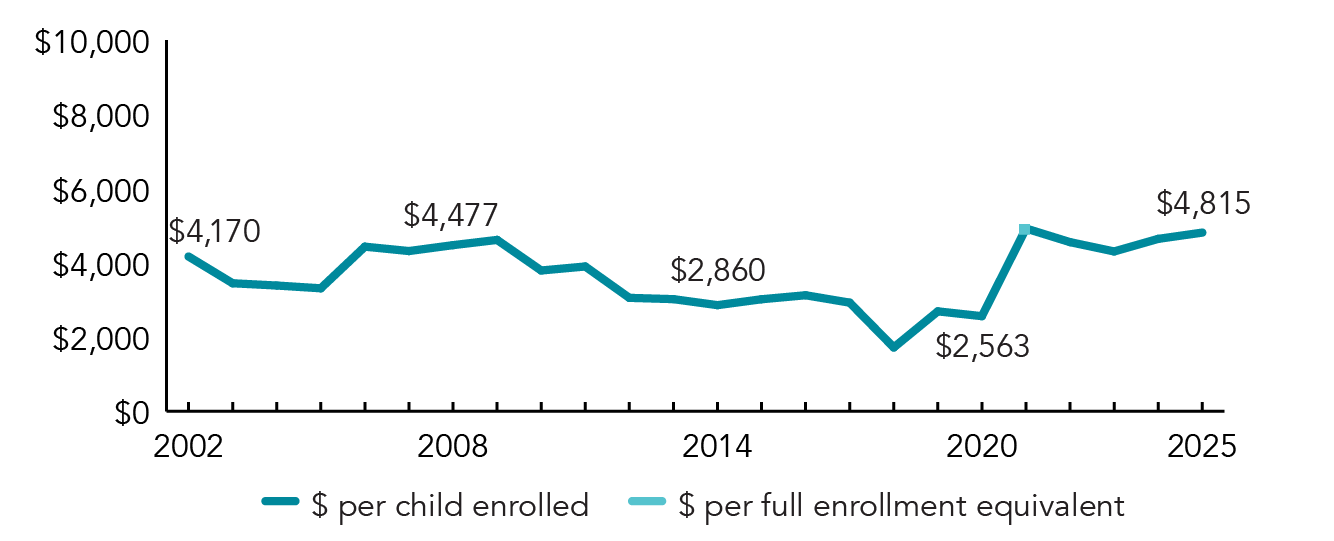
During the 2024-2025 school year, Kansas preschool enrolled 24,805 children, an increase of 569 from the prior year. State spending totaled $115,314,617, and an additional $4,132,317 in TANF funds, up $6,836,219 (6%), adjusted for inflation, since last year. State spending per child (including TANF) equaled $4,815 in 2024-2025, up $169 from 2023-2024, adjusted for inflation. Kansas met 6 of 10 quality standards benchmarks.
What's New
The Kansas State Board of Education and the Kansas Children’s Cabinet and Trust Fund both adopted the fourth revision to the Kansas Early Learning Standards in February 2024. Also, 2024-2025 was the first year of an updated accreditation model for PreK-12 school systems. Preschool/early childhood is included in this work, which aligns nicely with preschool-specific quality improvement efforts related to high quality instructional materials adoption, supports for effective teaching and use of data to inform instruction, and the
science of reading.
Beginning July 1, 2028, Kansas veteran educators serving in a number of positions, including general education and special education preschool teaching positions, will be required to demonstrate knowledge of the science of reading to renew their professional license.Kansas also has an exciting and growing Registered Teacher Apprenticeship Program.
The Kansas Education Funding Task Force is currently reviewing the current state school finance formula, which expires July 1, 2027.
Background
Kansas supports two funding streams for state prekindergarten. The first, established in 1998 as part of the state school finance formula, is the Preschool-Aged At-Risk Program (formerly named the State Pre-K 4 Year Old At-Risk Program). The state school finance formula also includes funding to support the enrollment of preschool students with disabilities. The second is the Kansas Preschool Pilot (KPP), first offered in the 2006-2007 school year. Both funding streams are administered through the Kansas State Department of Education (KSDE) and are reported together due to their similar standards and overlapping enrollment.
Between the two funding streams, funding was available in all 286 school districts in Kansas, and 2024-2025 marks the fourth year that 3-year-olds are included in this report.
Preschool Offered by Public School Districts
Access
| |
| Total state pre-K enrollment | 24,805 |
| School districts that offer state program | 100% |
| Income requirement | 130% FPL |
| Minimum hours of operation | 465 hours/year |
| Operating schedule | School or academic year |
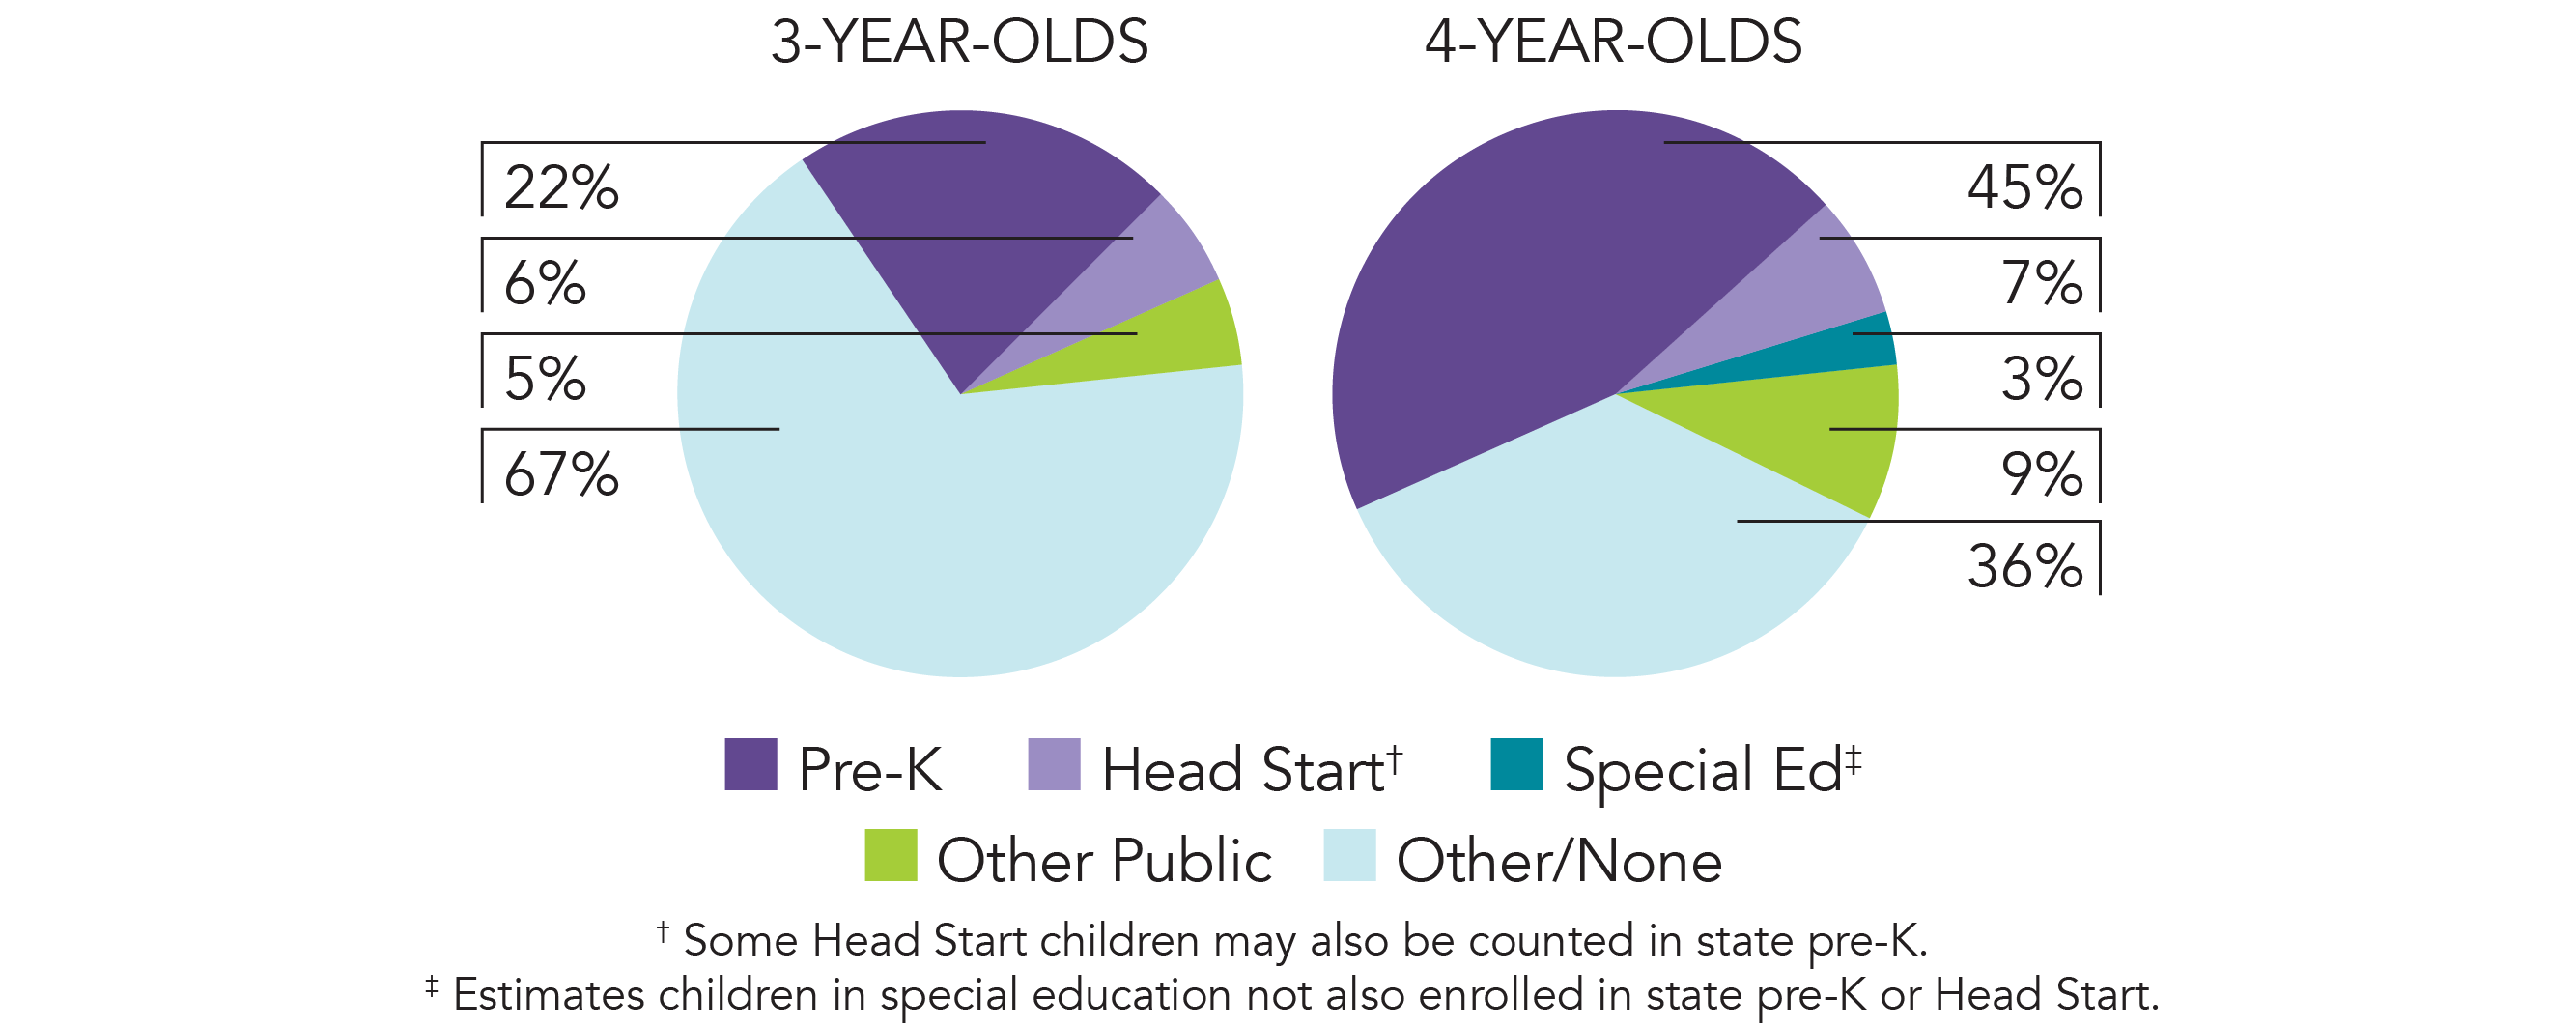
| Special education enrollment, ages 3 and 4 | 8,174 |
| Federally funded Head Start enrollment, ages 3 and 4 | 4,337 |
| State-funded Head Start enrollment, ages 3 and 4 | 0 |
Resources
| Total state pre-K spending | $119,446,934 |
| Local match required? | No |
| State Head Start spending | $0 |
| State spending per child enrolled | $4,815 |
| All reported spending per child enrolled* | $4,815 |

*Pre-K programs may receive additional funds from federal or local sources that are not included in this figure. †Head Start per-child spending includes funding only for 3- and 4-year-olds. ‡K–12 expenditures include capital spending as well as current operating expenditures.
Kansas Quality Standards Checklist
| Policy | Requirement | Benchmark | Meets Benchmark? |
|---|---|---|---|
For more information about the benchmarks, see the Executive Summary and the Roadmap to State pages. | 6benchmarks met | ||
| Early Learning & Development Standards Benchmark | Comprehensive, aligned, supported, culturally sensitive | Comprehensive, aligned, supported, culturally sensitive | |
| Curriculum Supports Benchmark | Approval process & supports | Approval process & supports | |
| Teacher Degree Benchmark | BA | BA | |
| Teacher Specialized Training Benchmark | ECE, CD, Elem. Ed. | Specializing in pre-K | |
| Assistant Teacher Degree Benchmark | Other | CDA or equivalent | |
| Staff Professional Development Benchmark | 15 hours/year; PD plans (teachers only); Coaching (some teachers) | For teachers & assistants: At least 15 hours/year; individual PD plans; coaching | |
| Maximum Class Size Benchmark | 20 (3- & 4-year-olds) | 20 or lower | |
| Staff to Child Ratio Benchmark | 1:10 (3- & 4-year-olds) | 1:10 or better | |
| Screening & Referral Benchmark | Vision, hearing, health & more | Vision, hearing & health screenings; & referral | |
| Continuous Quality Improvement System Benchmark | None | Structured classroom observations; data used for program improvement | |