State of Preschool
Delaware
Access Rankings
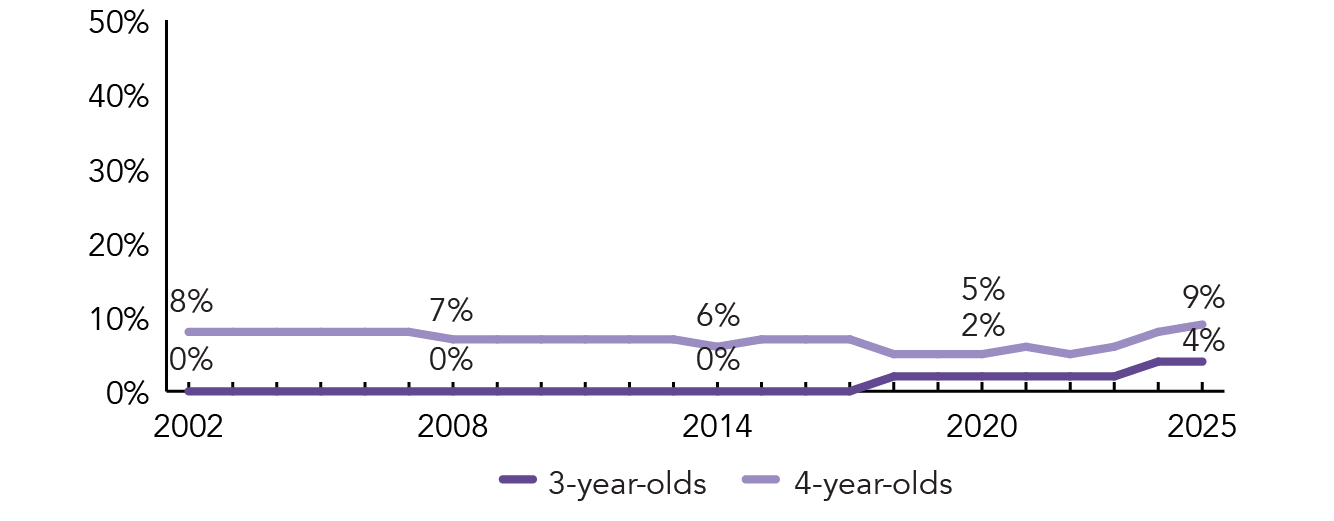
4-year-Olds
42
3-year-Olds
24
Resource Rankings
State spending
8
All reported spending
11
Total Benchmarks Met
Of 10 benchmarks possible
9
Overview
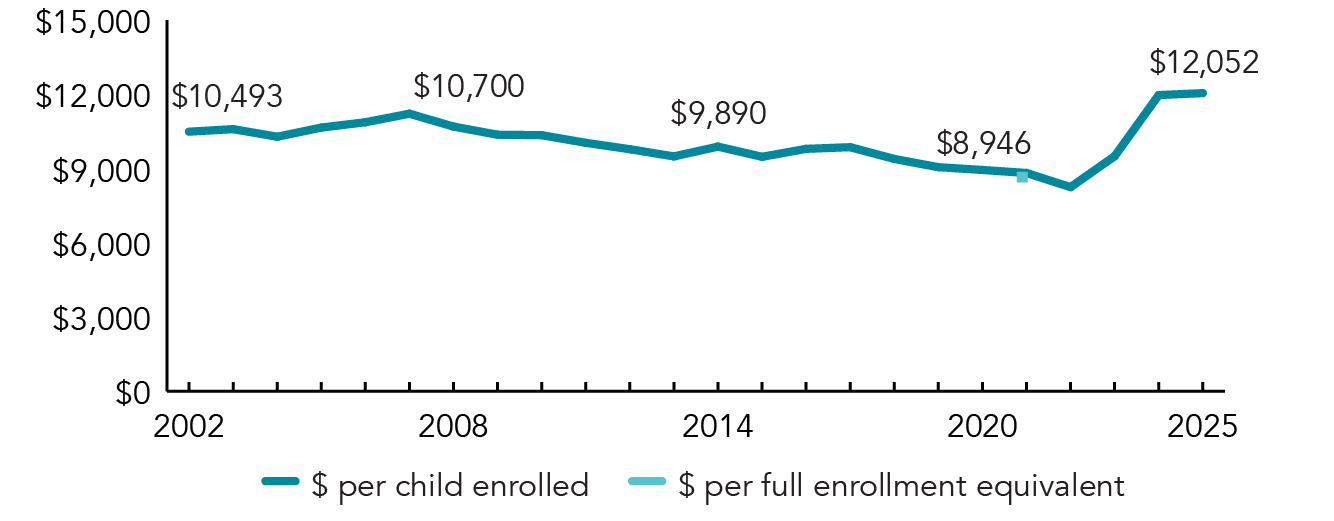
During the 2024-2025 school year, Delaware preschool enrolled 1,418 children, an increase of 180 from the prior year. State spending totaled $17,090,424, up $2,269,696 (15%), adjusted for inflation, since last year. State spending per child averaged $12,052 in 2024-2025, up $81 from 2023-2024, adjusted for inflation. Full-day preschool seats are funded at $14,500 and half-day seats are funded at $7,250. Delaware met 9 of 10 quality standards benchmarks.
What's New
The State Funded Early Care and Education Programs (SFECEP) blend the Early Childhood Assistance Program (ECAP) and the Redding Consortium funding streams, both of which are state funding streams. Delaware’s new Governor and Secretary of Education are supporting state-funded preschool by deeming it as the model and foundation for building a comprehensive, universal preschool program for all children and families.
A new round of PDG B–5 Systems Building Grants were awarded in December 2025 to support states in building systems and strengthening their ECE programs that expand parental choice in a mixed-delivery system, improve system efficiency and collaboration, and raise the overall quality of programs. Delaware received $11,312,524 in this latest round to use in 2026.
Background
The Delaware Early Childhood Assistance Program (ECAP) began in 1994, providing comprehensive early learning services for 4-year- olds eligible for the federal Head Start program. Eligibility expanded to 3-year-olds in 2017-2018.
Originally modeled after the federal Head Start program, SFECEP requires participating programs to follow a statewide policies and procedures manual with required standards. Per these standards, ten percent of enrollment slots are reserved for children with disabilities. Beginning in the 2024-2025 school year, children were eligible for SFECEP if they had a family income up 200% of the federal poverty level.
SFECEP awards are available to private and public child care programs, such as for-profit child care, Head Start agencies, public schools, community-based organizations, family child care, and faith-based centers through an RFP process. Contracts for funded SFECEP seats are determined based on Community Needs Assessment Data. In addition to preschool, SFECEP funded 295 seats for infants an toddlers during the 2024-2025 program year.
Delaware Early Care And Education Programs
Access
| |
| Total state pre-K enrollment | 1,418 |
| School districts that offer state program | 38% |
| Income requirement | 200% FPL |
| Minimum hours of operation | 3.5 hours/day; 5 days/week |
| Operating schedule | 170 days/year |
| Special education enrollment, ages 3 and 4 | 2,809 |
| Federally funded Head Start enrollment, ages 3 and 4 | 473 |
| State-funded Head Start enrollment, ages 3 and 4 | 0 |
Resources
| Total state pre-K spending | $17,090,424 |
| Local match required? | No |
| State Head Start spending | $0 |
| State spending per child enrolled | $12,052 |
| All reported spending per child enrolled* | $12,052 |
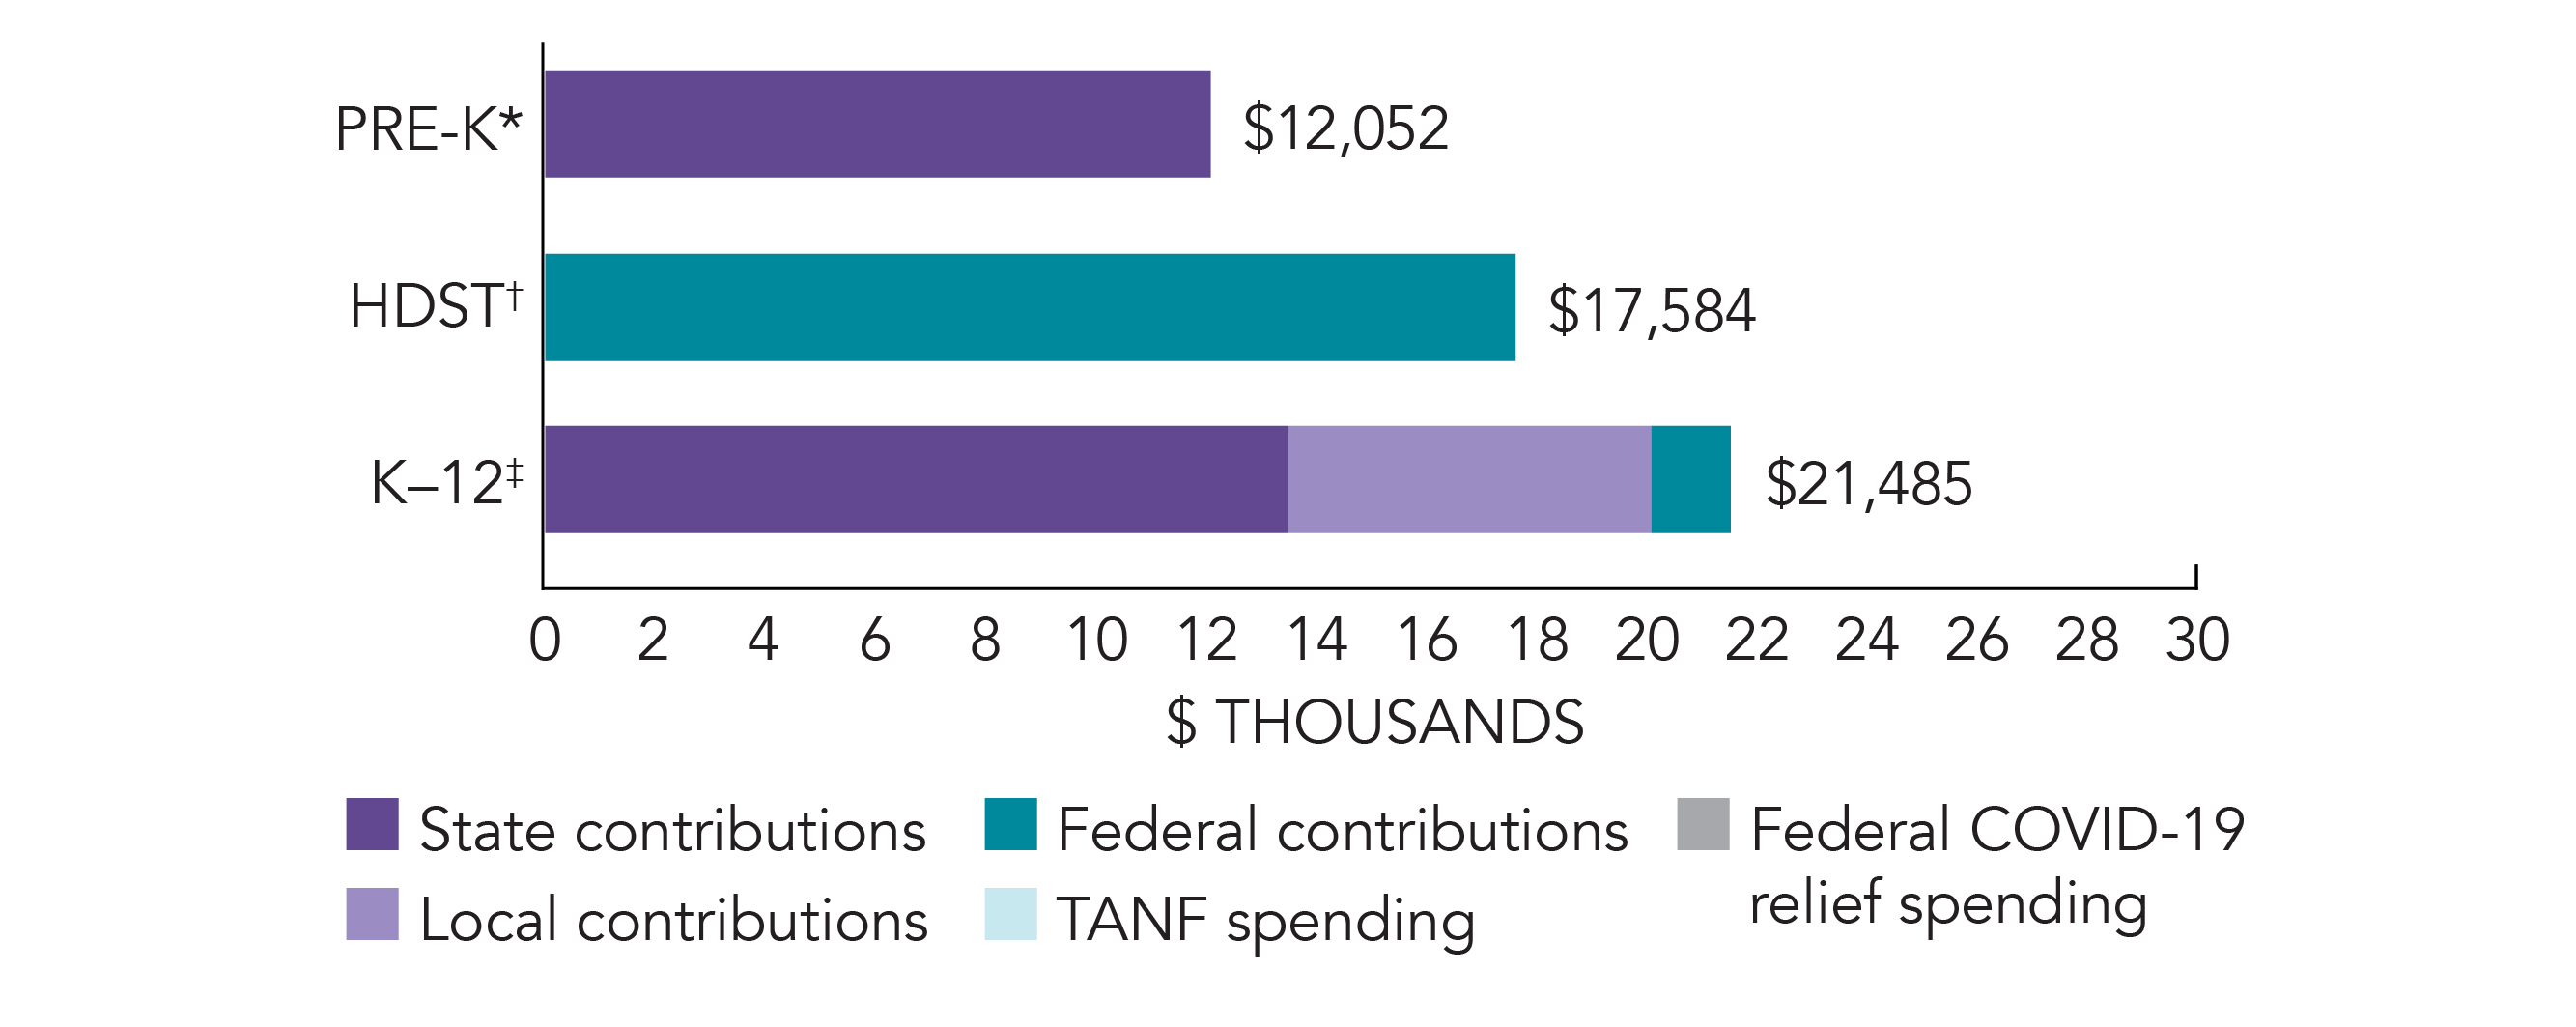
*Pre-K programs may receive additional funds from federal or local sources that are not included in this figure. †Head Start per-child spending includes funding only for 3- and 4-year-olds. ‡K–12 expenditures include capital spending as well as current operating expenditures.
Delaware Quality Standards Checklist
| Policy | Requirement | Benchmark | Meets Benchmark? |
|---|---|---|---|
For more information about the benchmarks, see the Executive Summary and the Roadmap to State pages. | 9benchmarks met | ||
| Early Learning & Development Standards Benchmark | Comprehensive, aligned, supported, culturally sensitive | Comprehensive, aligned, supported, culturally sensitive | |
| Curriculum Supports Benchmark | Approval process & supports | Approval process & supports | |
| Teacher Degree Benchmark | BA (public); At least AA with 50% BA (nonpublic) | BA | |
| Teacher Specialized Training Benchmark | ECE, CD, ECE SpEd | Specializing in pre-K | |
| Assistant Teacher Degree Benchmark | Working towards CDA or equivalent | CDA or equivalent | |
| Staff Professional Development Benchmark | 90 hours/5 years (public teachers); 18 hours/year (nonpublic teachers & assistants); 15 hours/year (public assistants); PD plans; Coaching | For teachers & assistants: At least 15 hours/year; individual PD plans; coaching | |
| Maximum Class Size Benchmark | 17 (3-year-olds); 20 (4-year-olds) | 20 or lower | |
| Staff to Child Ratio Benchmark | 2:17 (3-year-olds); 1:10 (4-year-olds) | 1:10 or better | |
| Screening & Referral Benchmark | Vision, hearing, health & more | Vision, hearing & health screenings; & referral | |
| Continuous Quality Improvement System Benchmark | Structured classroom observations; Data used for program improvement | Structured classroom observations; data used for program improvement | |