State of Preschool
Access Rankings
4-year-Olds
5
3-year-Olds
21
Resource Rankings
State spending
41
All reported spending
44
Total Benchmarks Met
Of 10 benchmarks possible
8
Overview
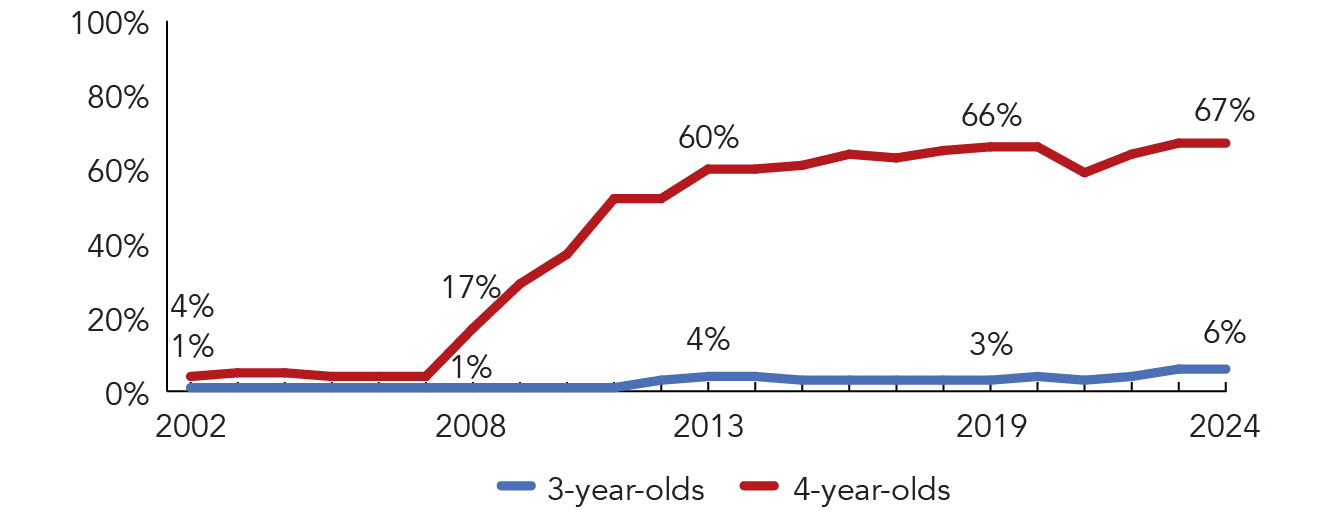
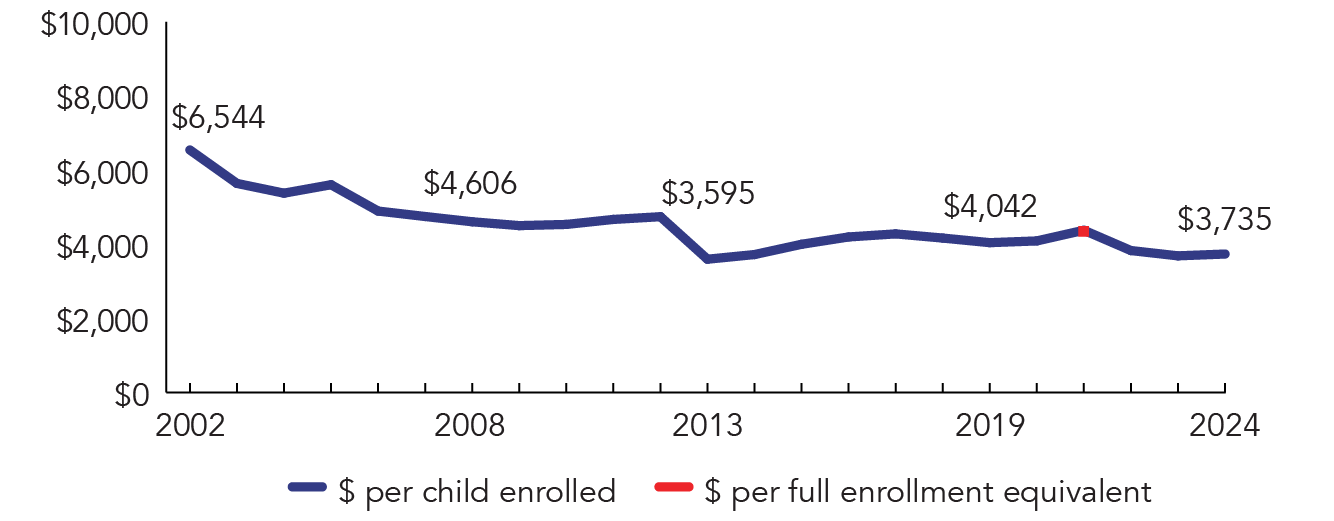
During the 2023-2024 school year, Iowa preschool enrolled 28,189 children, a decrease of 5 from the prior year. State spending totaled $96,606,841, up $746,282 (1%), adjusted for inflation, since last year. State spending per child equaled $3,735 in 2023-2024, up $49 from 2022-2023, adjusted for inflation. Iowa met an average of 8 of 10 quality standard benchmarks.
What's New
During the 2023-2024 school year, Shared Visions (SV) modified its income eligibility guidelines from a family income at or below 130% FPL to 185% FPL, resulting in more children eligible for services.
During the 2023-2024 school year, the Statewide Voluntary Preschool Program (SWVPP) offered LETRS for Early Childhood Educators professional development opportunity to all preschool teachers at no cost. Additionally, during the 2024-2025 school year, state legislation required that literacy instruction for SWVPP include the science of reading concepts and methodologies.
Background
Iowa has two state-funded preschool programs: Shared Visions (SV) and the Statewide Voluntary Preschool Program (SWVPP). The SV program has provided services to 3-, 4-, and 5-year-olds since 1989 through competitive grants to public schools, licensed non-profit childcare centers, other public non-profit agencies, and Head Start. SV serves children in part-, school-, or extended-day programs.
Iowa began the SWVPP in 2007 to increase 4-year-olds’ access to preschool. All 4-year-olds in the state are eligible to attend SWVPP. Funding for the SWVPP is based on the state funding formula in which 4-year-olds are funded at 50% of the K–12 state aid amount. SWVPP classrooms operate at least 10 hours per week and programs may collaborate with Head Start, other preschool programs, or childcare programs to provide the SWVPP. Some collaborations offer full-day services.
Both SWVPP and SV have undergone formal evaluations. As part of the state longitudinal data system, all children enrolled in either program receive a unique state identification number.
An important difference between the two state-funded preschool programs pertains to child eligibility. SV is a targeted program where at least 80% of children are required to meet income eligibility guidelines (family income at or below 185% FPL). Children can also qualify for the program based on other risk factors but may be required to pay a fee based on a sliding scale. Services within this program are provided in 29 of Iowa’s 99 counties through 48 awarded grants. Programming is offered in 23 school district locations (within 16 school districts), representing less than 5% of school districts. In addition, services are provided in 26 other community-based locations, representing 11 organizations. In contrast, SWVPP, is available in 99% of school districts and all resident children who turn four by September 15 are eligible to attend.
SV lead teachers are required to meet the educational qualifications as outlined in the program standards selected within the awarded application. While requirements within selected program standards vary, 66% of lead teachers hold a BA degree or higher in early childhood, child development, or a related field, while another 26% hold an AA degree in early childhood or a related field. All SWVPP lead teachers must have at least a BA and an Iowa teaching license with an early childhood endorsement.
-
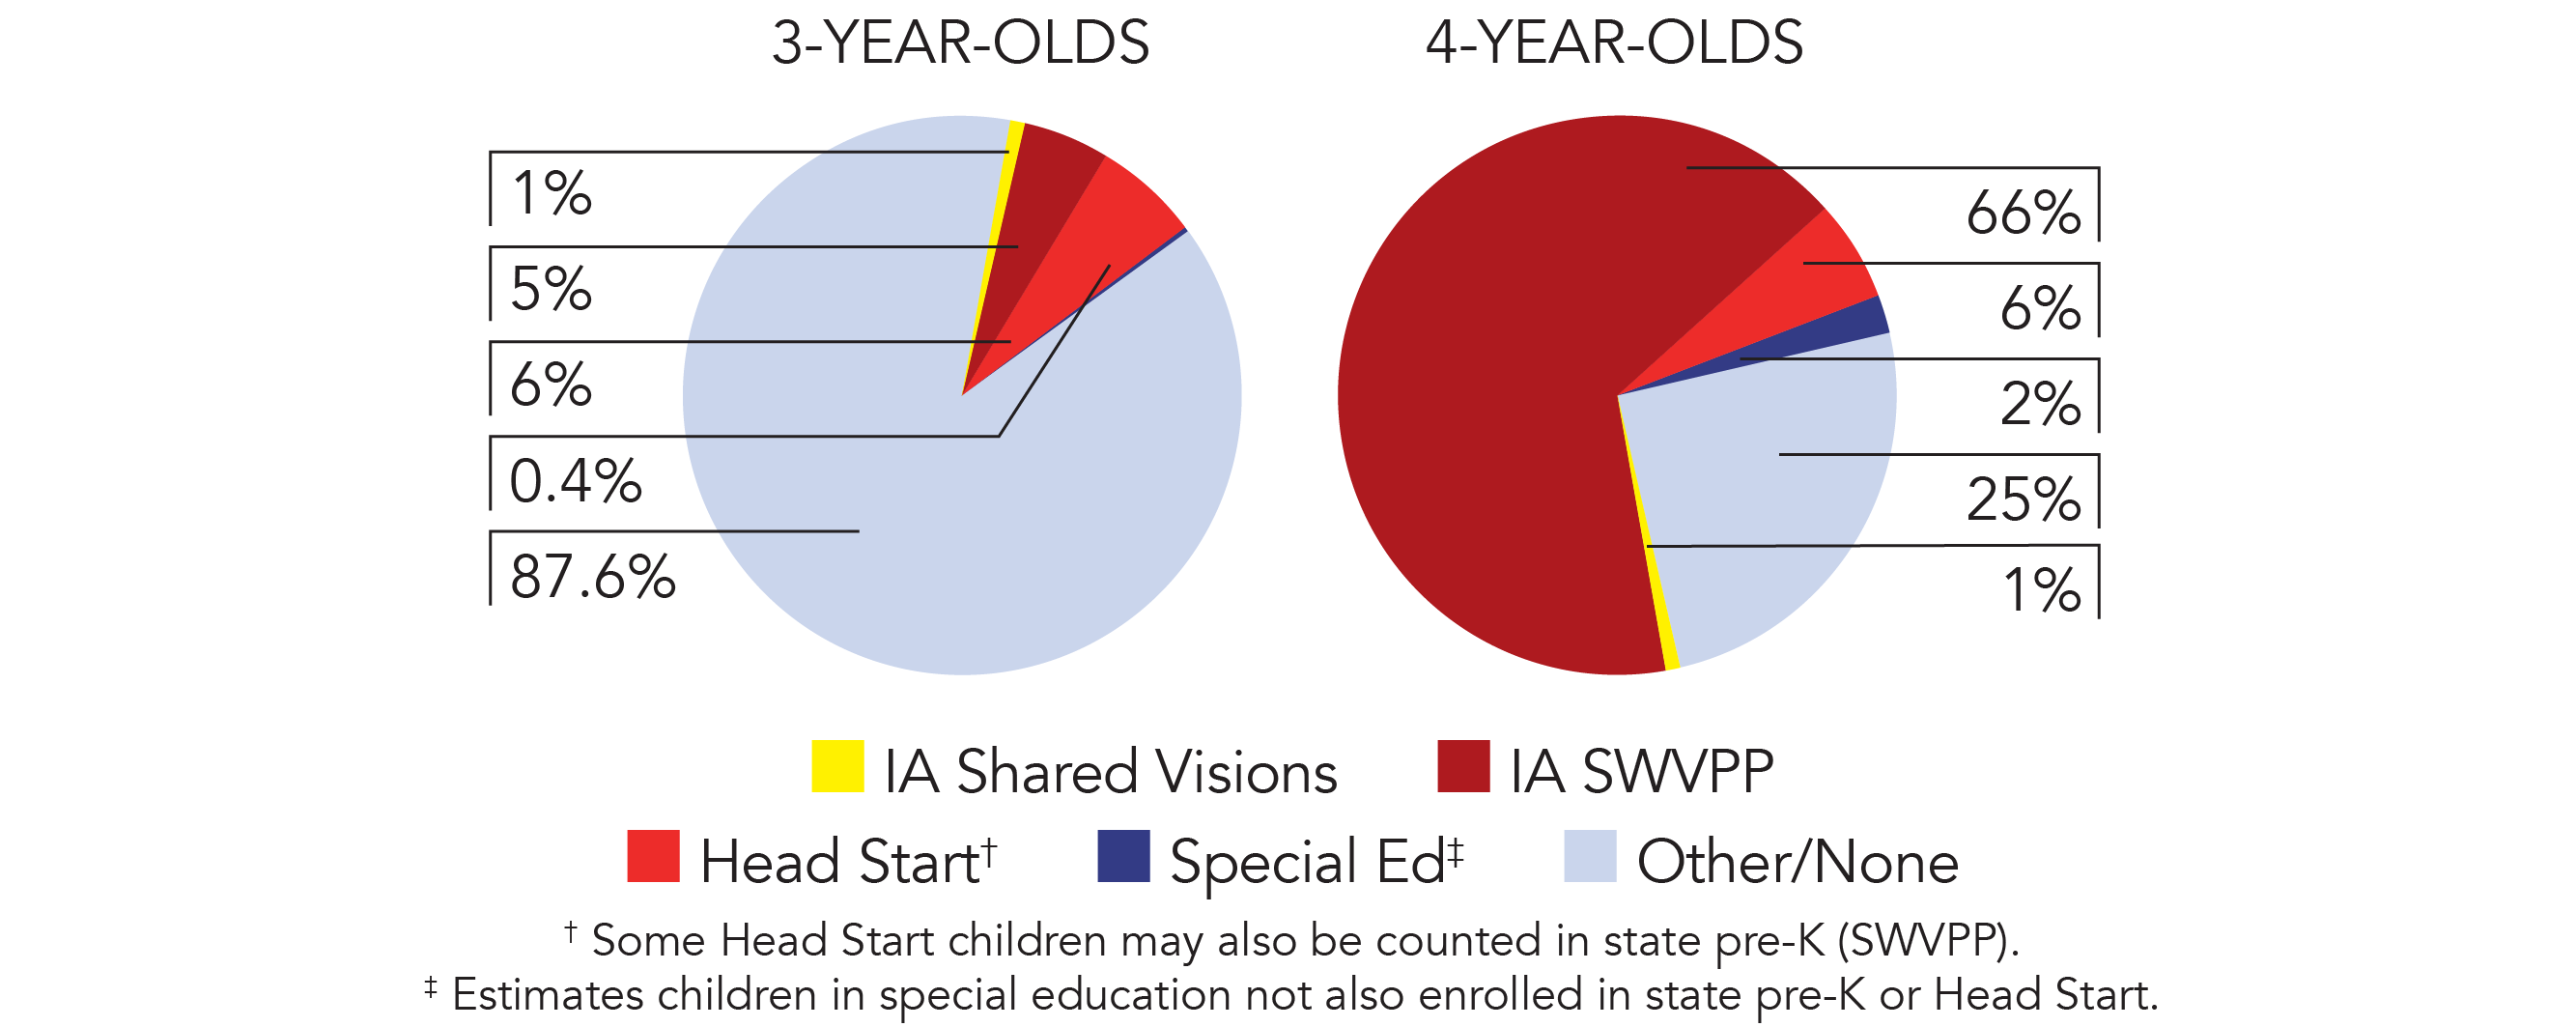
Access

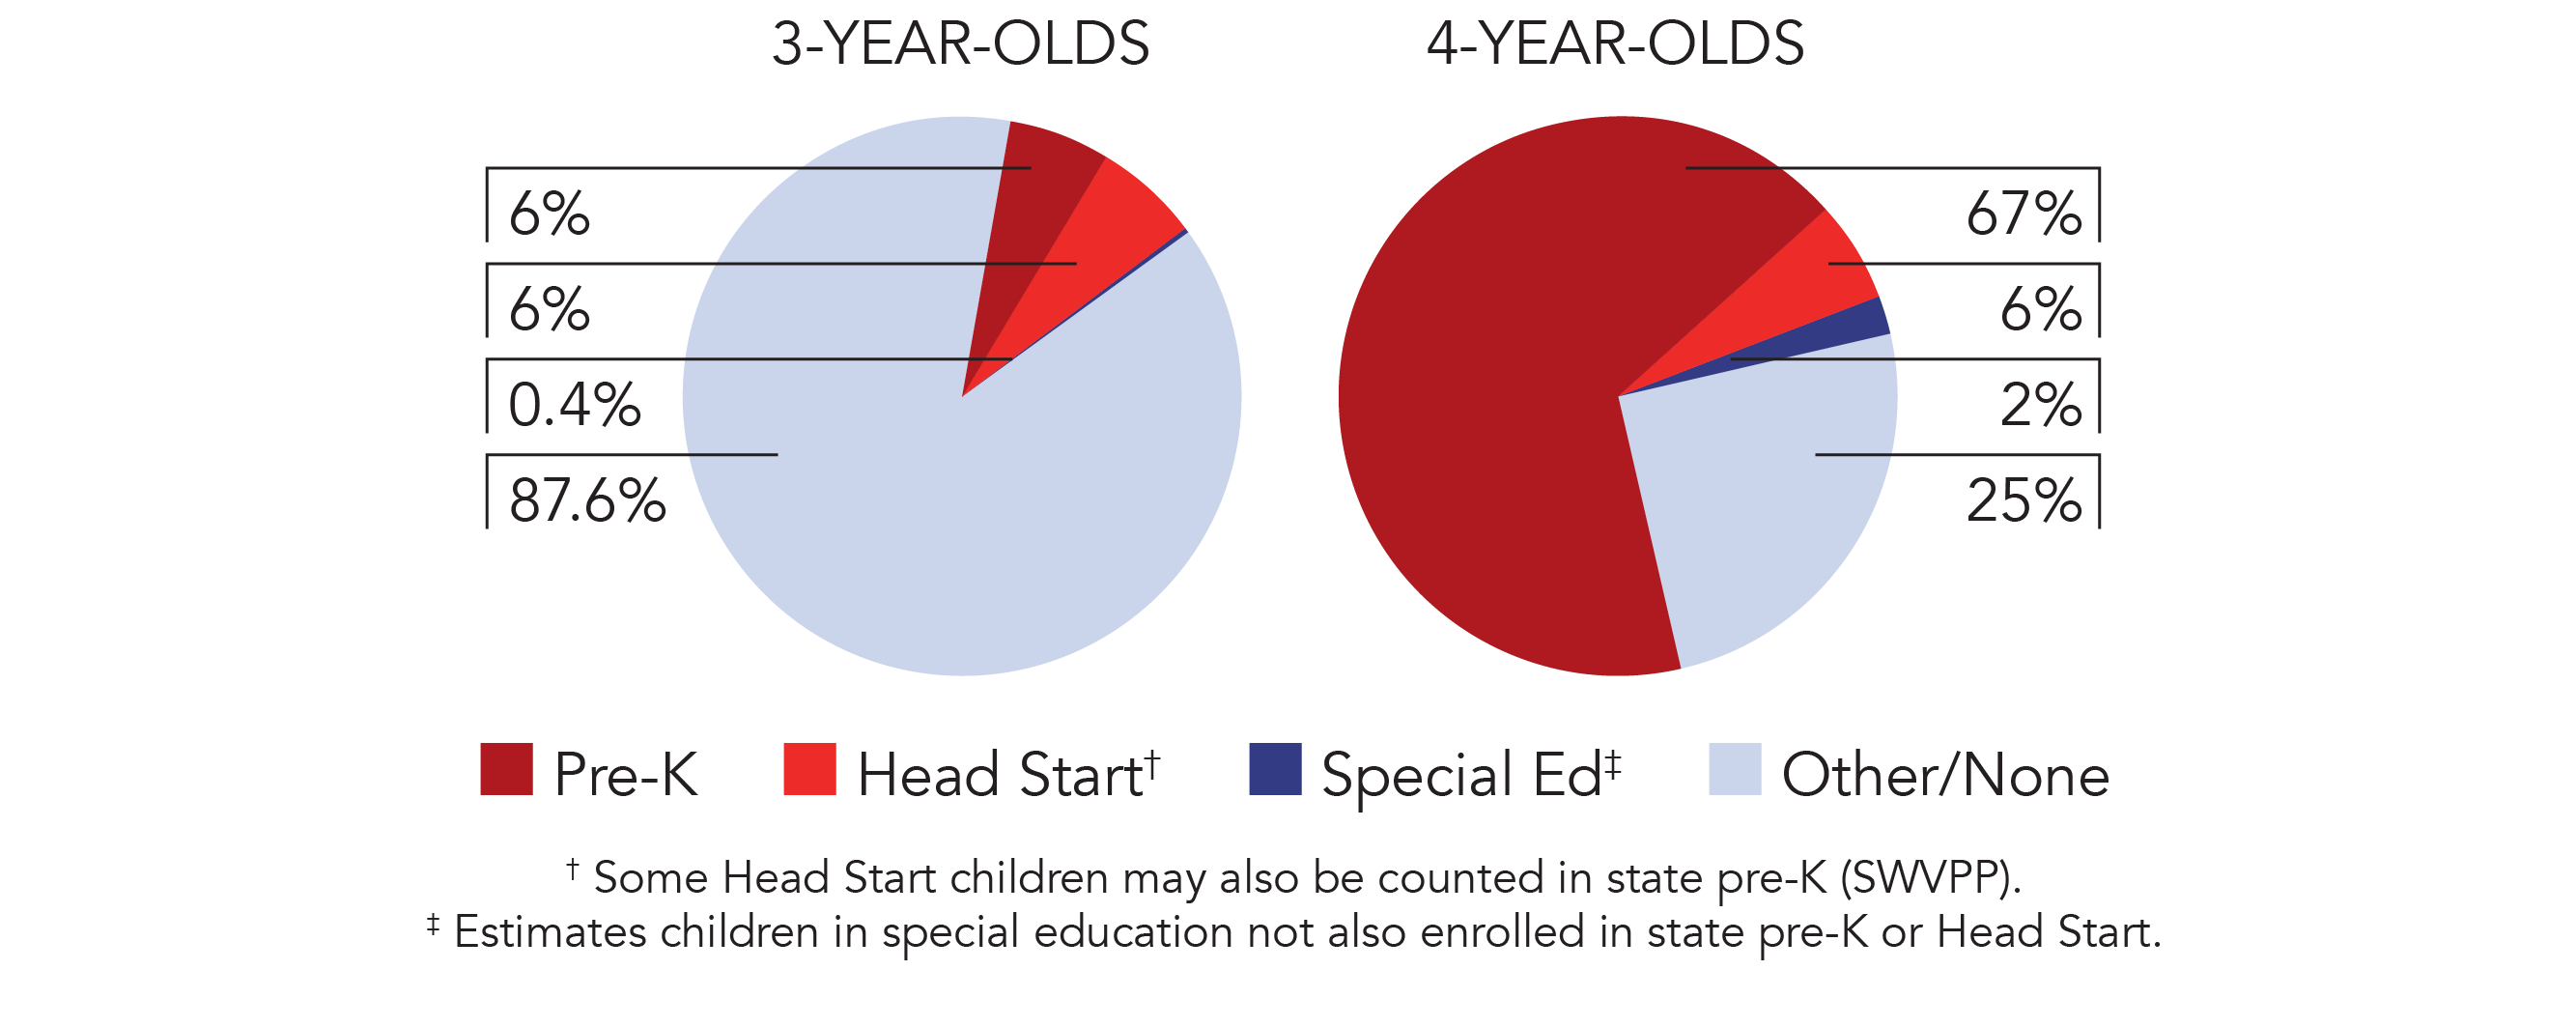
Total state pre-K enrollment 28,189 Special education enrollment, ages 3 and 4 4,106 Federally funded Head Start enrollment, ages 3 and 4 4,905 State-funded Head Start enrollment, ages 3 and 4 0 Resources
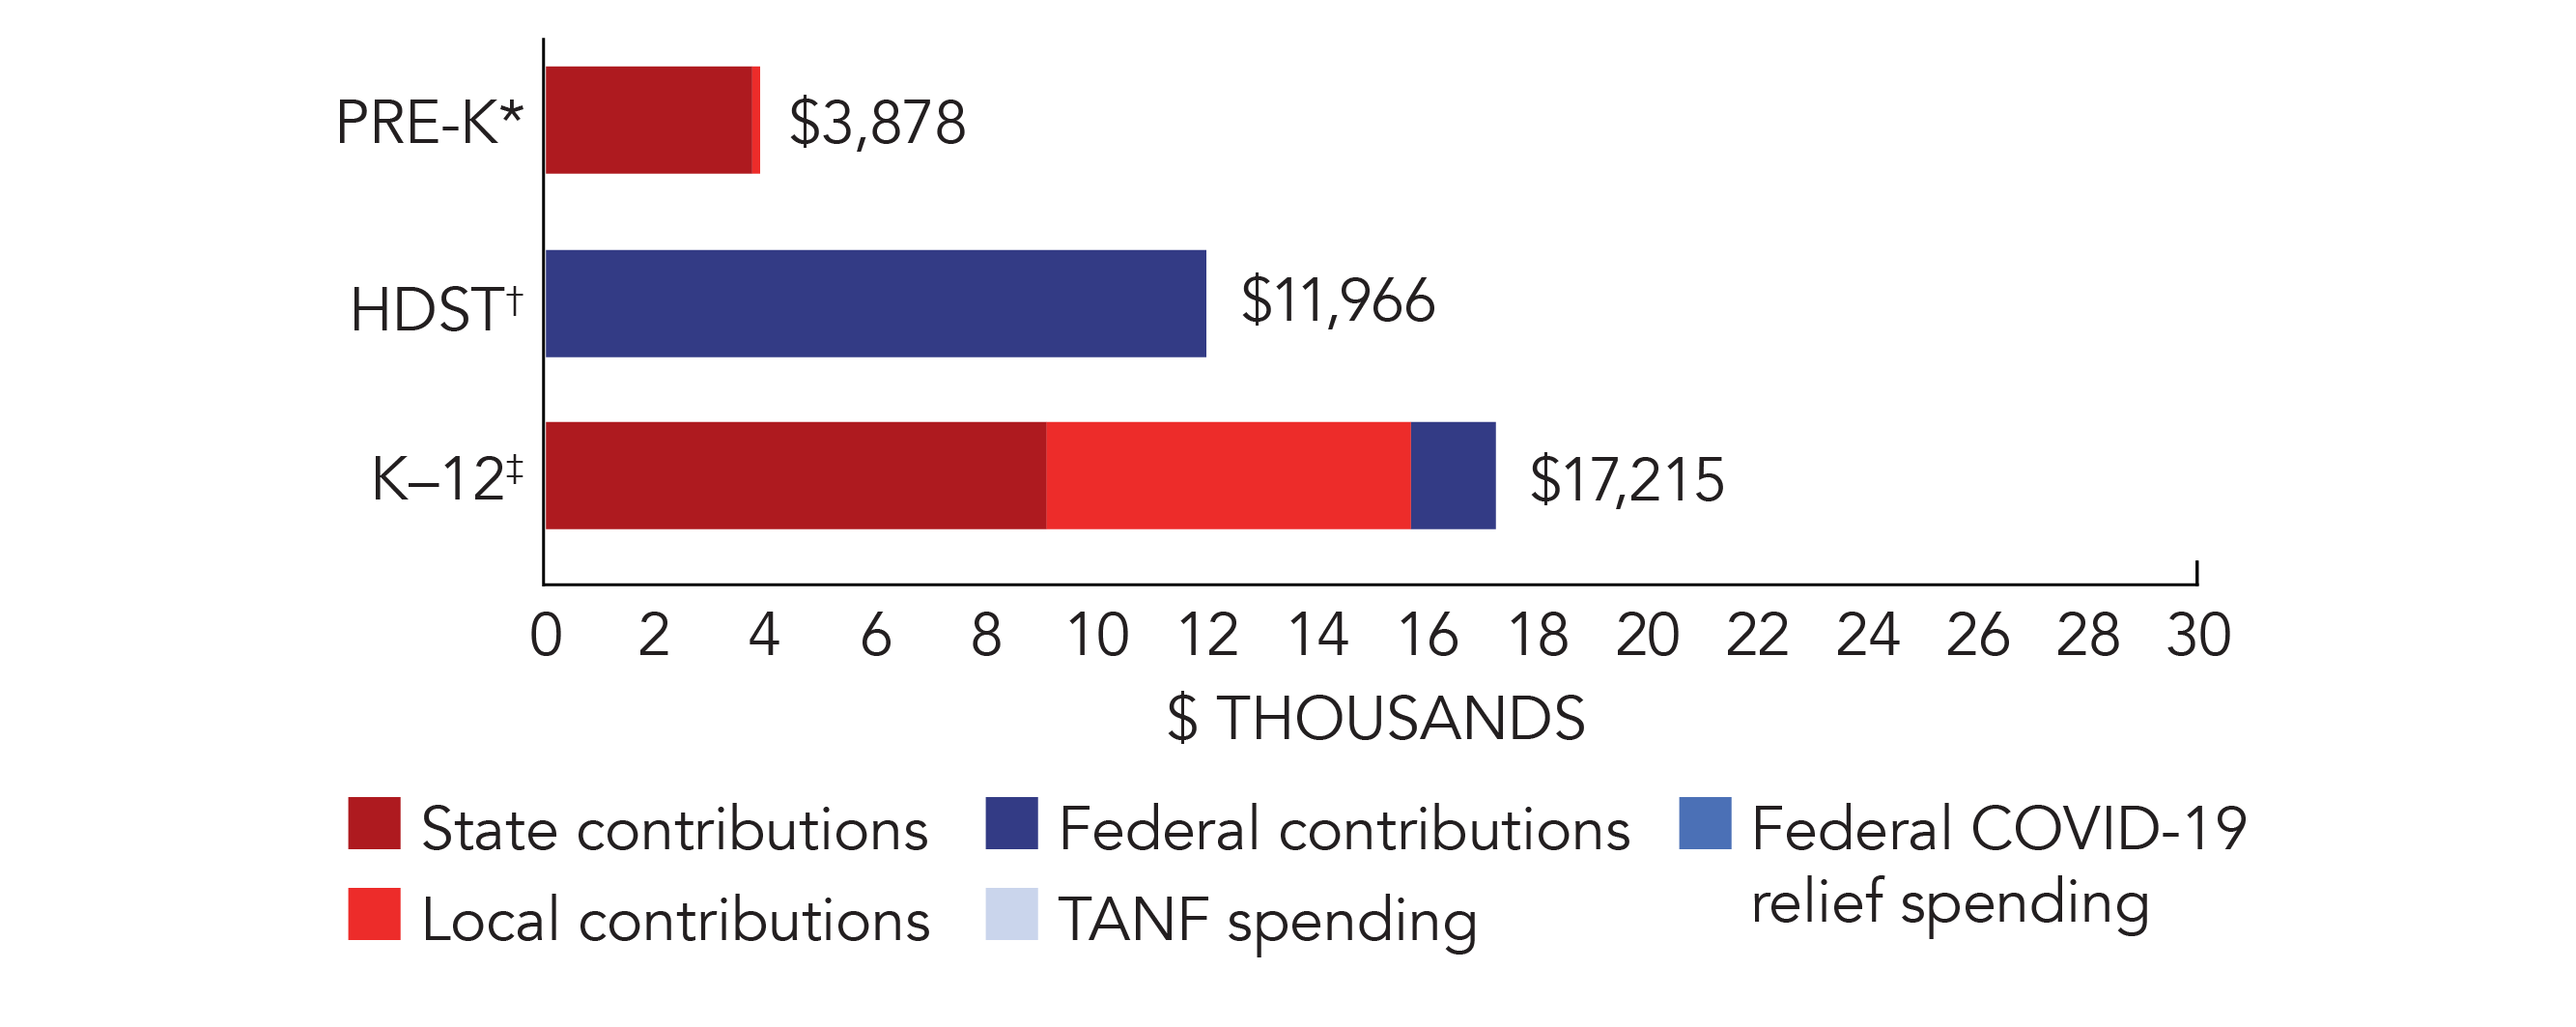
Total state pre-K spending $96,606,841 State Head Start spending $0 State spending per child enrolled $3,735 All reported spending per child enrolled* $3,878 
*Pre-K programs may receive additional funds from federal or local sources that are not included in this figure. †Head Start per-child spending includes funding only for 3- and 4-year-olds. ‡K–12 expenditures include capital spending as well as current operating expenditures.
-
Access

Total state pre-K enrollment 1,122 School districts that offer state program 29% (counties) Income requirement 185% FPL Minimum hours of operation Determined locally Operating schedule Determined locally Resources
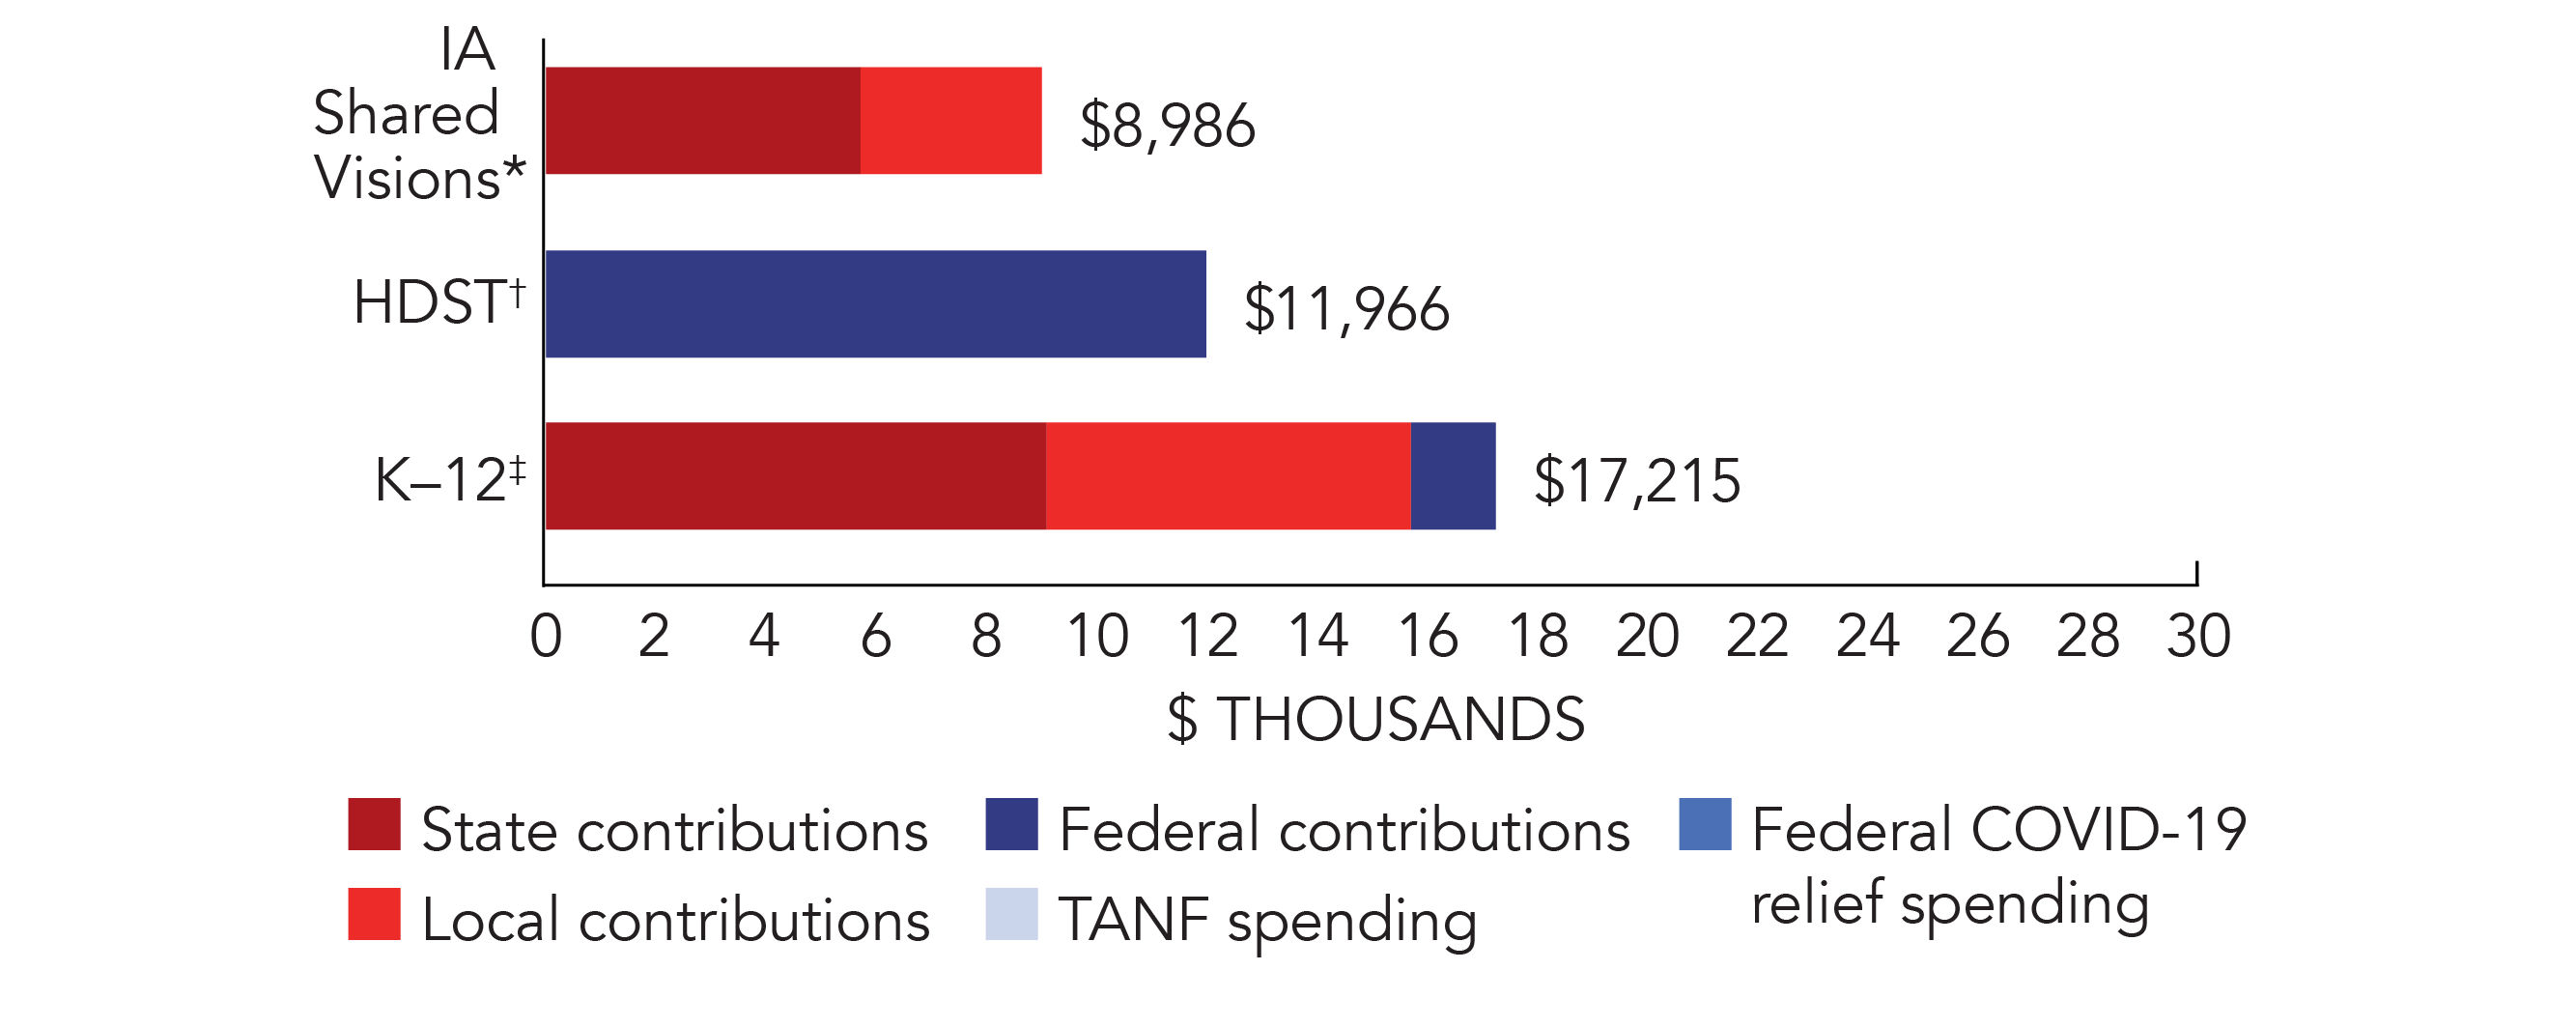
Total state pre-K spending $6,391,823 Local match required? Yes State spending per child enrolled $5,697 All reported spending per child enrolled* $8,986 
*Pre-K programs may receive additional funds from federal or local sources that are not included in this figure. †Head Start per-child spending includes funding only for 3- and 4-year-olds. ‡K–12 expenditures include capital spending as well as current operating expenditures.
Iowa Shared Visions Quality Standards Checklist
| Policy | IA Shared Visions Requirement | Benchmark | Meets Benchmark? |
|---|---|---|---|
For more information about the benchmarks, see the Executive Summary and the Roadmap to State pages. | 7benchmarks met | ||
| Early Learning & Development Standards Benchmark | Comprehensive, aligned, supported, culturally sensitive | Comprehensive, aligned, supported, culturally sensitive | |
| Curriculum Supports Benchmark | Approval process & supports | Approval process & supports | |
| Teacher Degree Benchmark | BA (public); AA (nonpublic) | BA | |
| Teacher Specialized Training Benchmark | ECE, CD | Specializing in pre-K | |
| Assistant Teacher Degree Benchmark | CDA or equivalent | CDA or equivalent | |
| Staff Professional Development Benchmark | PD hours based on program standards; PD plans, Coaching (teachers with an active teaching license only) | For teachers & assistants: At least 15 hours/year; individual PD plans; coaching | |
| Maximum Class Size Benchmark | 17 (3-year-olds), 20 (4-year-olds) | 20 or lower | |
| Staff to Child Ratio Benchmark | 1:8 (3- & 4-year-olds) | 1:10 or better | |
| Screening & Referral Benchmark | Vision, hearing, health & more | Vision, hearing & health screenings; & referral | |
| Continuous Quality Improvement System Benchmark | Structured classroom observations (every 5 years and determined locally); Data used for program improvement | Structured classroom observations; data used for program improvement | |
-
Access
Total state pre-K enrollment 27,067 School districts that offer state program 99% Income requirement No income requirement Minimum hours of operation 10 hours/week Operating schedule Determined locally Resources
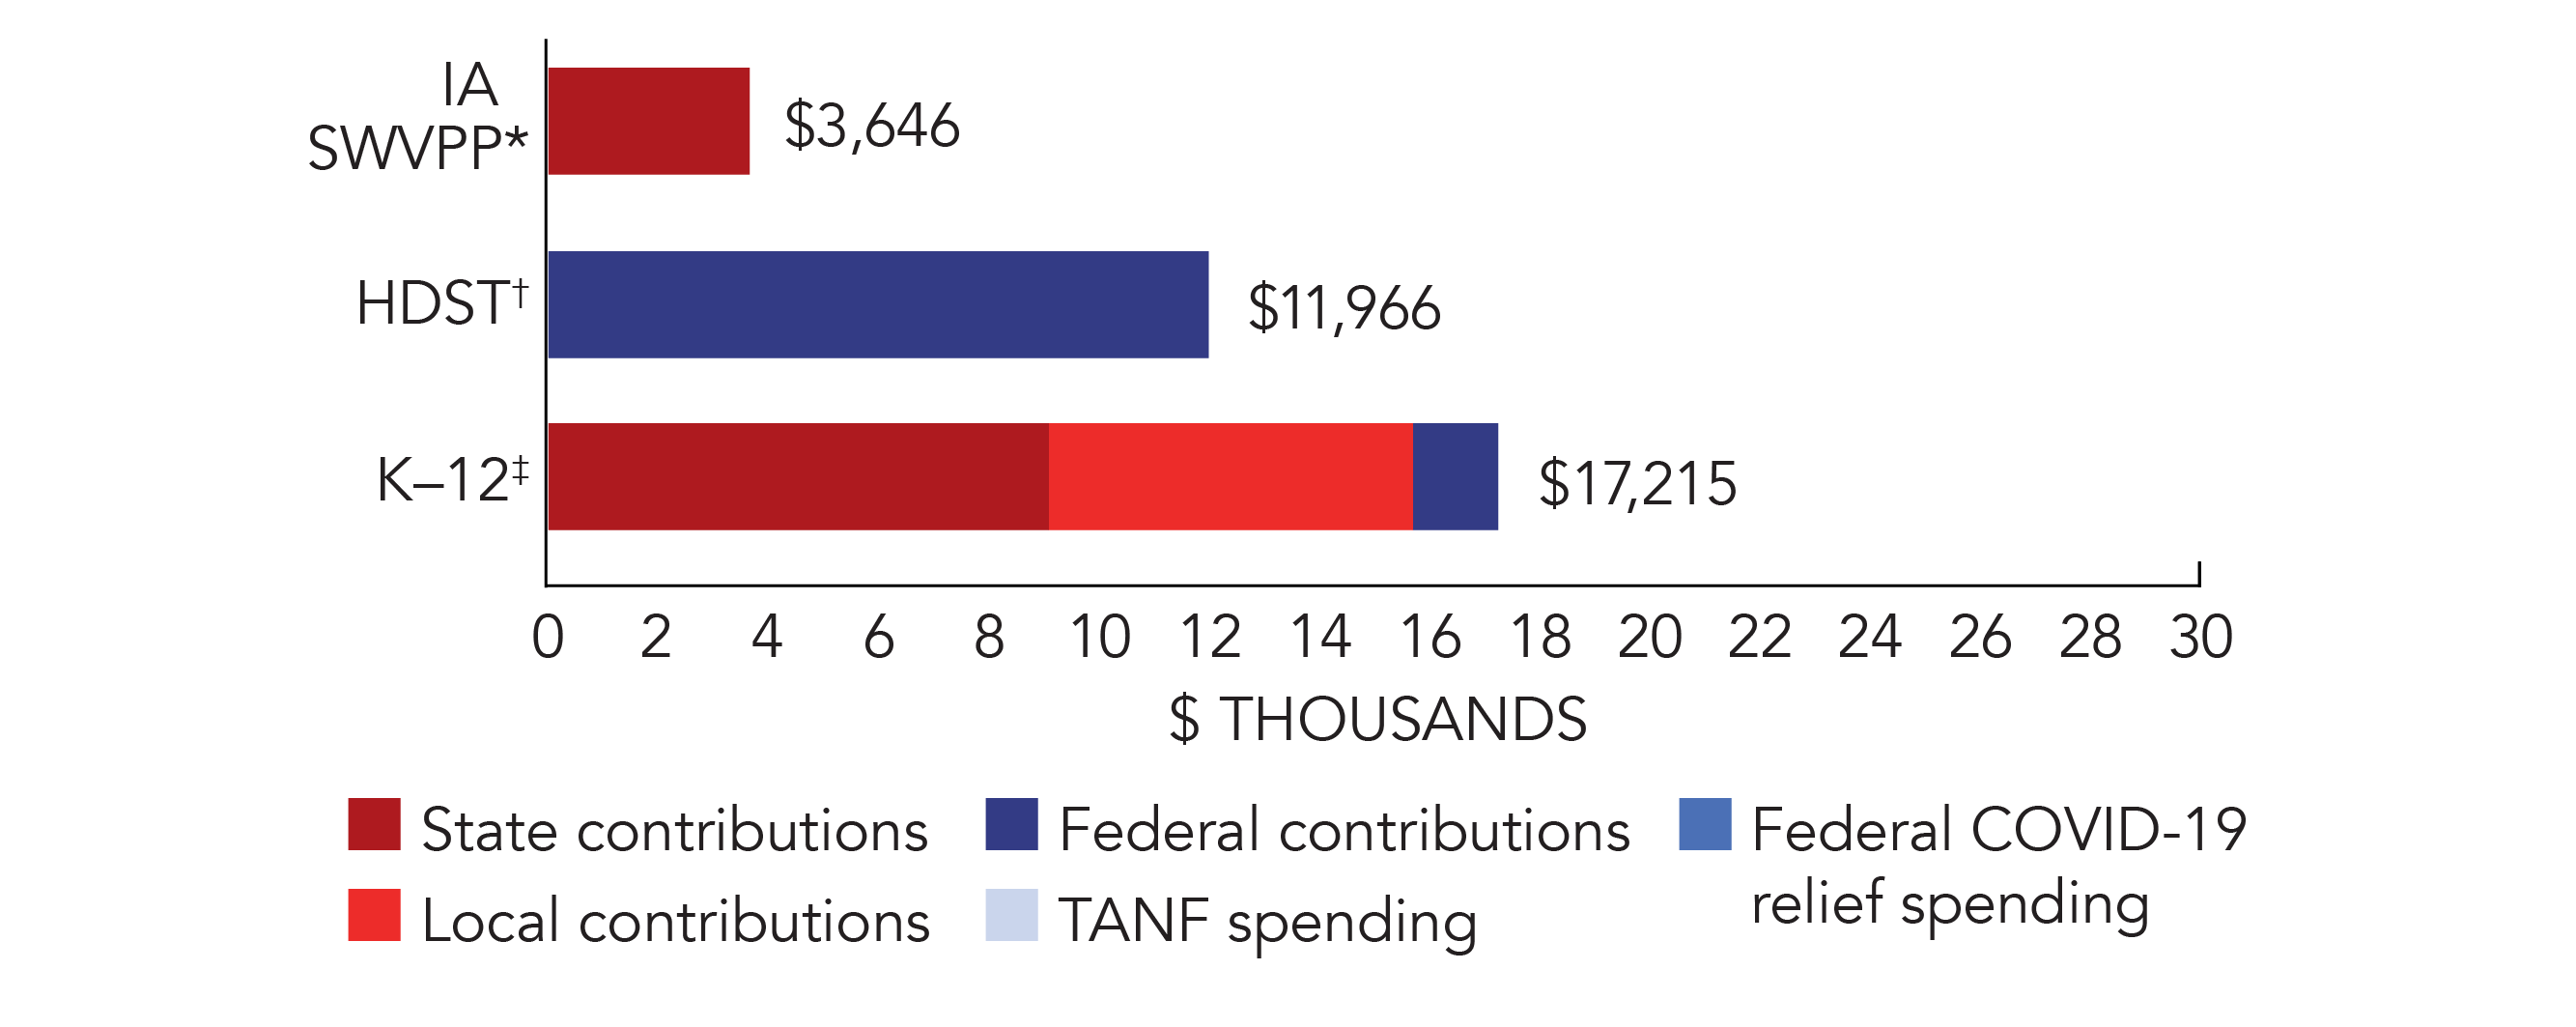
Total state pre-K spending $90,215,018 Local match required? No State spending per child enrolled $3,646 All reported spending per child enrolled* $3,646 
*Pre-K programs may receive additional funds from federal or local sources that are not included in this figure. †Head Start per-child spending includes funding only for 3- and 4-year-olds. ‡K–12 expenditures include capital spending as well as current operating expenditures.
Iowa Statewide Voluntary Preschool Program Quality Standards Checklist
| Policy | IA SWVPP Requirement | Benchmark | Meets Benchmark? |
|---|---|---|---|
For more information about the benchmarks, see the Executive Summary and the Roadmap to State pages. | 8benchmarks met | ||
| Early Learning & Development Standards Benchmark | Comprehensive, aligned, supported, culturally sensitive | Comprehensive, aligned, supported, culturally sensitive | |
| Curriculum Supports Benchmark | Approval process & supports | Approval process & supports | |
| Teacher Degree Benchmark | BA | BA | |
| Teacher Specialized Training Benchmark | ECE, CD, Elem Ed (with ECE endorsement) | Specializing in pre-K | |
| Assistant Teacher Degree Benchmark | CDA or equivalent | CDA or equivalent | |
| Staff Professional Development Benchmark | 15 hours/year recommended; PD plans; Coaching (public only) | For teachers & assistants: At least 15 hours/year; individual PD plans; coaching | |
| Maximum Class Size Benchmark | 20 (3- & 4-year-olds) | 20 or lower | |
| Staff to Child Ratio Benchmark | 1:10 (3- & 4-year-olds) | 1:10 or better | |
| Screening & Referral Benchmark | Vision, hearing, health & more | Vision, hearing & health screenings; & referral | |
| Continuous Quality Improvement System Benchmark | Structured classroom observations; Data used for program improvement at the local level only | Structured classroom observations; data used for program improvement | |