State of Preschool
Indiana
Access Rankings
4-year-Olds
N/A
3-year-Olds
N/A
Resource Rankings
State spending
N/A
All reported spending
N/A
Total Benchmarks Met
Of 10 benchmarks possible
2
Overview
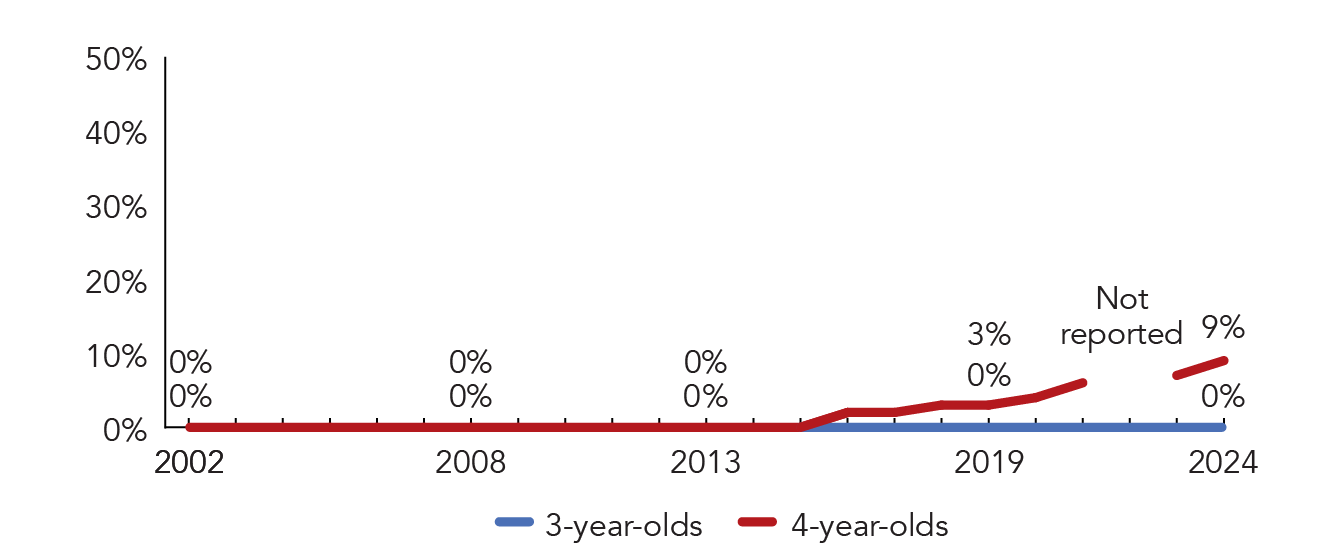
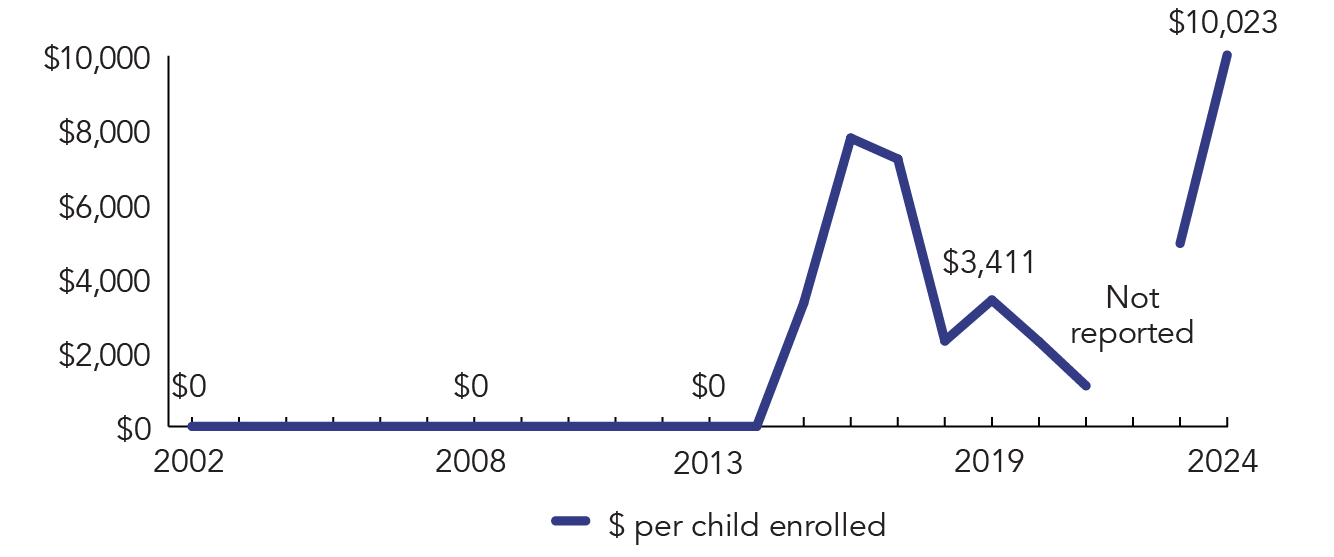
During the 2023-2024 school year, Indiana enrolled 7,948 four-year-olds in its On My Way Pre-K program. State spending totaled $21,997,370 and an additional $57,667,756 in federal recovery funds supported the program. State spending per child (including federal recovery funds) equaled $10,023 in 2023-2024. Indiana met 2 of 10 quality standards benchmarks. On My Way Pre-K has a parent employment or school requirement for eligibility and therefore does not meet NIEER’s definition of a state-funded preschool program. The program is included in the report this year but not in national totals or rankings.
What's New
In July 2023, family income eligibility for CCDF and On My Way PreK (OMWPK) increased from 127% of the federal poverty level to 150%, which meant that approximately 11,000 additional children and families to received assistance. The state also instituted a new cost-based approach for setting reimbursement rates by focusing on cost drivers, which allows providers across auspices, quality levels, geography, and the age groups they serve to be compared on an “apples-to-apples” basis. New rates offer a minimum 20% increase across all payments and additional increases for specific providers and care types where cost data showed inequities. Rates became effective July 30, 2023.
Additionally, Indiana received a total of $1.2 billion in Covid relief funding through CARES (March 2020), CRRSA (December 2020), and ARPA (February 2021). A portion of those funds were used by the Indiana Family and Social Services Administration (FSSA); Office of Early Childhood and Out-of-School Learning to support preschool and early childhood programming, including assisting over 50,000 families and over 3,500 early care and education providers in all 92 counties in the state. For more information about the reach of these initiatives and supports, see this link.
Background
The On My Way Pre-K program was signed into law in 2014 to provide vouchers to eligible, low-income four-year-old children for qualified early education services statewide. Services may be delivered via public schools, licensed, or registered child care programs that have achieved Level Three or Level Four in Paths to QUALITY™, or via accredited private schools.
According to the Purdue University longitudinal study, children who attended the On My Way Pre-K program had stronger school readiness, language, and literacy skills than their peers with similar family incomes who attended lower quality child care or prekindergarten programs. Additional research by Purdue University is studying the use of curricula in Indiana and identifying the key ingredients of high-quality preschool programs in Indiana. A second longitudinal study began in fall 2024. Additionally, On My Way Pre-K children have matched up positively compared to national norms established for all pre-kindergarten children in the annual Kindergarten Readiness Indicators assessment, conducted by the National Opinion Research Center (NORC) at the University of Chicago.
On My Way Pre-K has stimulated the expansion of the number of high-quality programs in Indiana, affecting not only the 4-year-old children enrolled with state funding, but all other children enrolled in those programs. There has been a stable 92% increase in high quality early care and education programs for all children statewide since the inception of On My Way Pre-K.
Indiana On My Way PRE-K
Access
| |
| Total state pre-K enrollment | 7,948 |
| School districts that offer state program | 96% (counties) |
| Income requirement | 150% FPL |
| Minimum hours of operation | 2.5 hours/day; 5 days/week |
| Operating schedule | School or academic year |
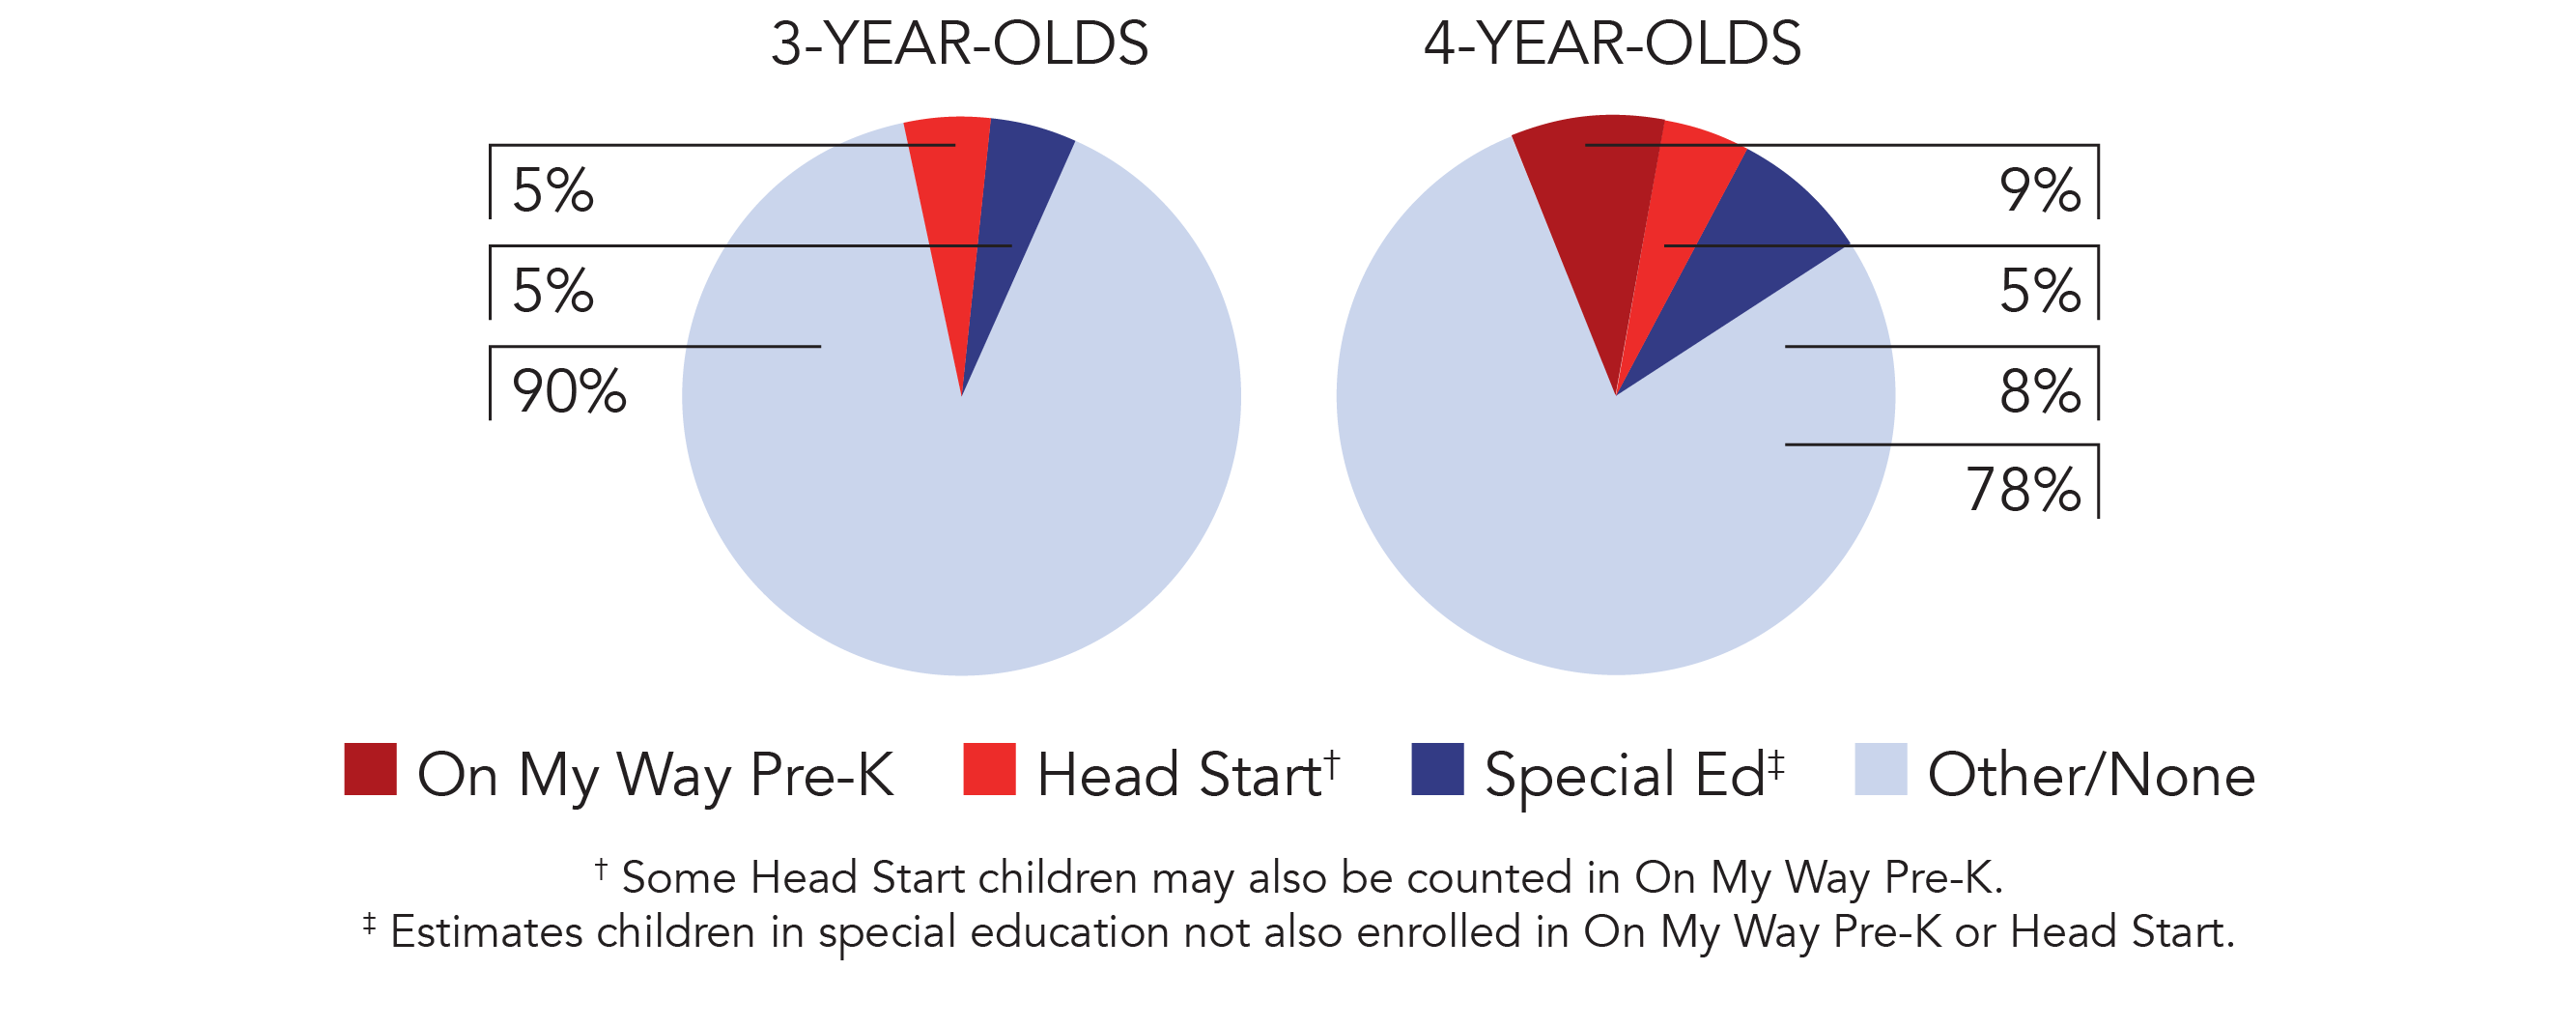
| Special education enrollment, ages 3 and 4 | 12,516 |
| Federally funded Head Start enrollment, ages 3 and 4 | 8,130 |
| State-funded Head Start enrollment, ages 3 and 4 | 0 |
Resources
| Total state pre-K spending | $79,665,126 |
| Local match required? | Yes |
| State Head Start spending | $0 |
| State spending per child enrolled | $10,023 |
| All reported spending per child enrolled* | $11,986 |
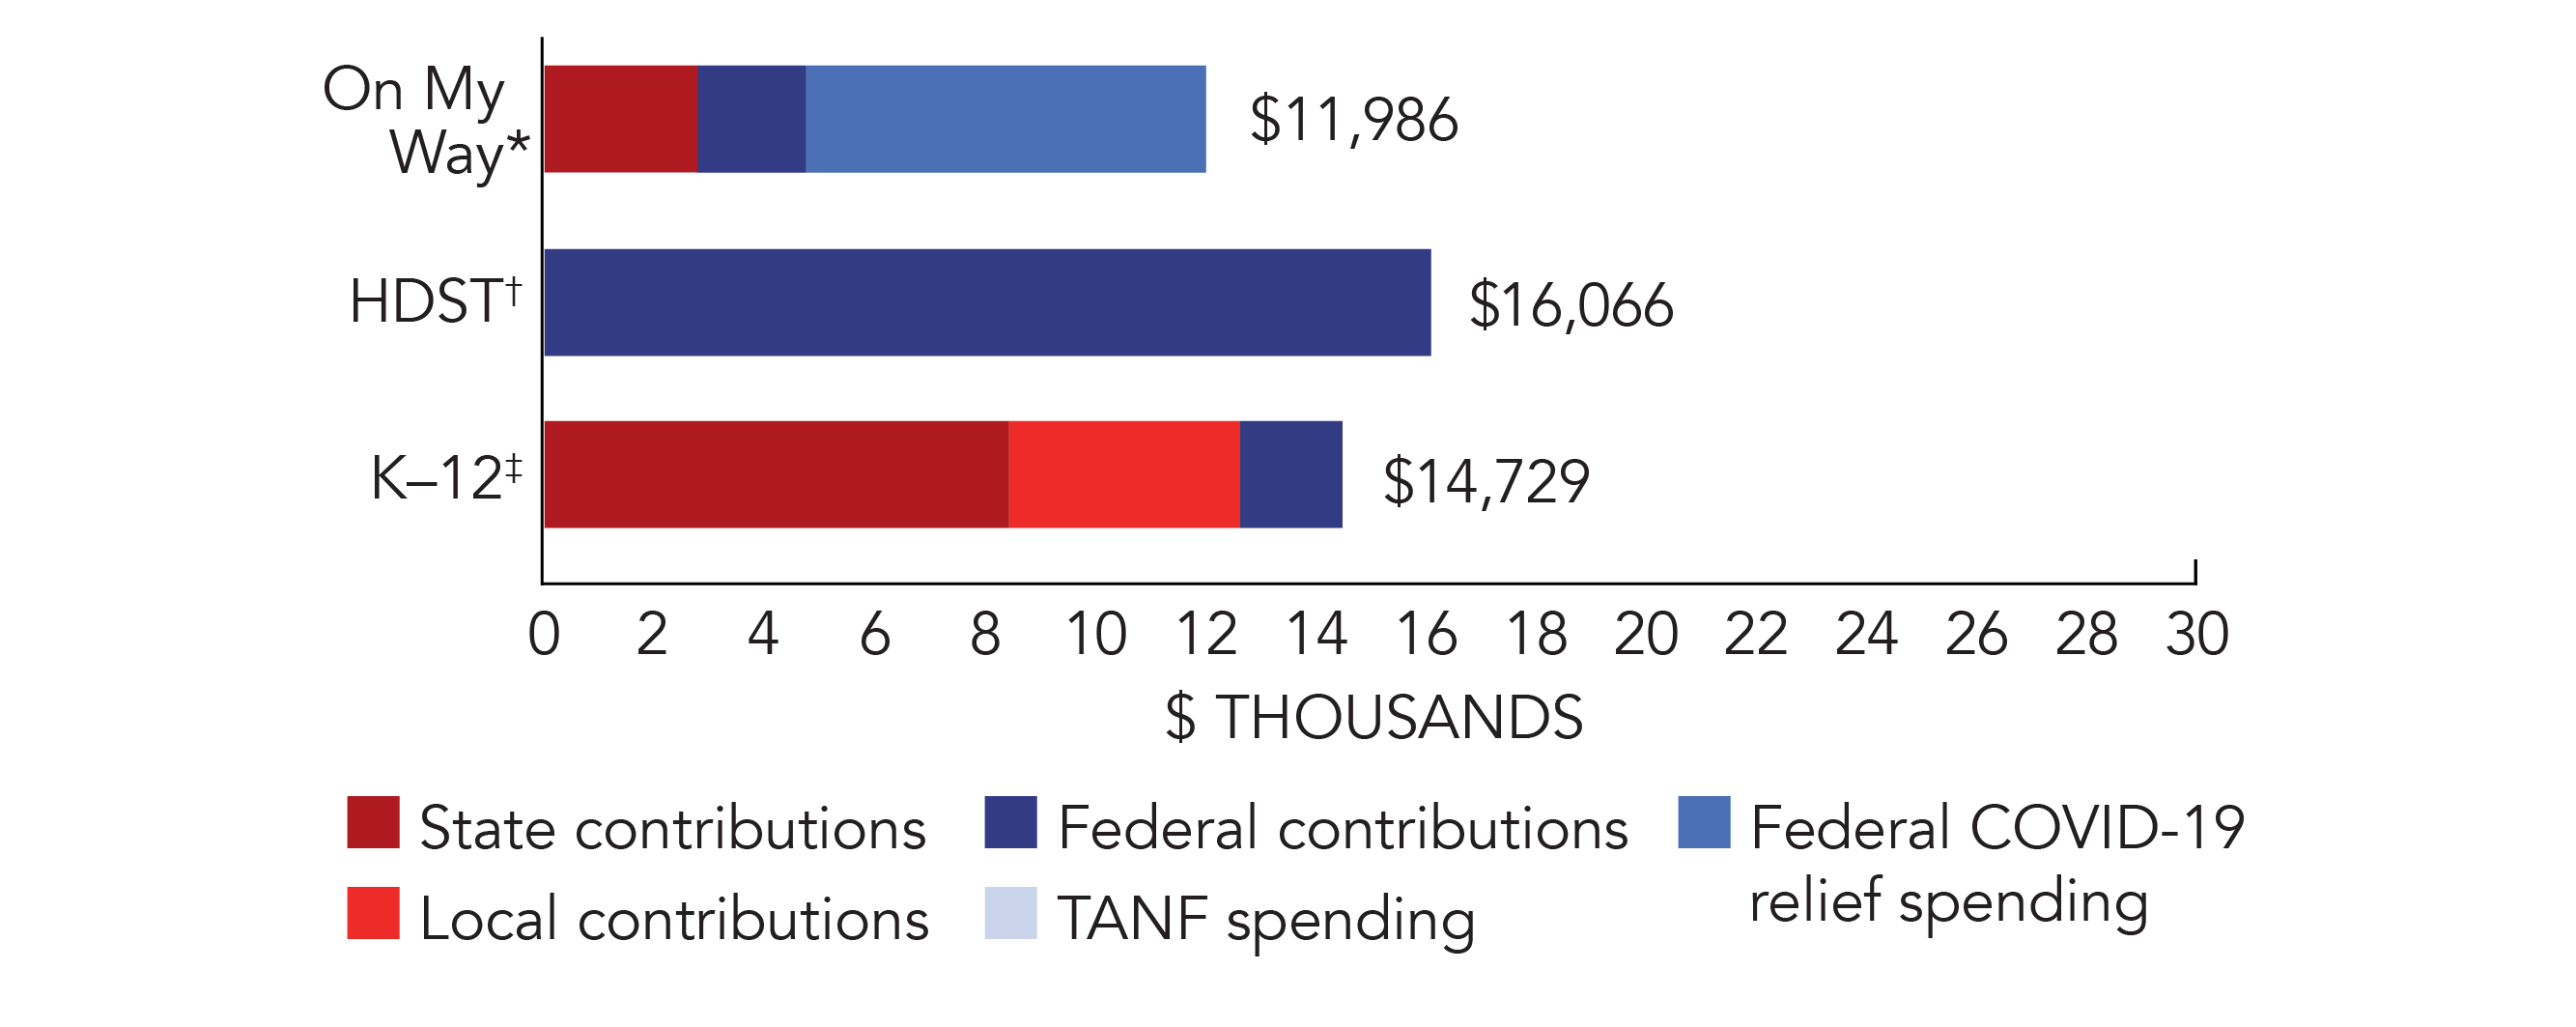
*Pre-K programs may receive additional funds from federal or local sources that are not included in this figure. †Head Start per-child spending includes funding only for 3- and 4-year-olds. ‡K–12 expenditures include capital spending as well as current operating expenditures.
Indiana Quality Standards Checklist
| Policy | Requirement | Benchmark | Meets Benchmark? |
|---|---|---|---|
For more information about the benchmarks, see the Executive Summary and the Roadmap to State pages. | 2benchmarks met | ||
| Early Learning & Development Standards Benchmark | Comprehensive, aligned, supported, culturally sensitive | Comprehensive, aligned, supported, culturally sensitive | |
| Curriculum Supports Benchmark | Approval process & supports | Approval process & supports | |
| Teacher Degree Benchmark | Varies by program requirements | BA | |
| Teacher Specialized Training Benchmark | Varies by program requirements | Specializing in pre-K | |
| Assistant Teacher Degree Benchmark | HSD | CDA or equivalent | |
| Staff Professional Development Benchmark | 12 clock hours/year; PD plans (public teachers) | For teachers & assistants: At least 15 hours/year; individual PD plans; coaching | |
| Maximum Class Size Benchmark | 20 (3-year-olds); 24 (4-year-olds) | 20 or lower | |
| Staff to Child Ratio Benchmark | 1:10 (3-year-olds); 1:12 (4-year-olds) | 1:10 or better | |
| Screening & Referral Benchmark | Immunizations; Referrals not required | Vision, hearing & health screenings; & referral | |
| Continuous Quality Improvement System Benchmark | None | Structured classroom observations; data used for program improvement | |