State of Preschool
Delaware
Access Rankings
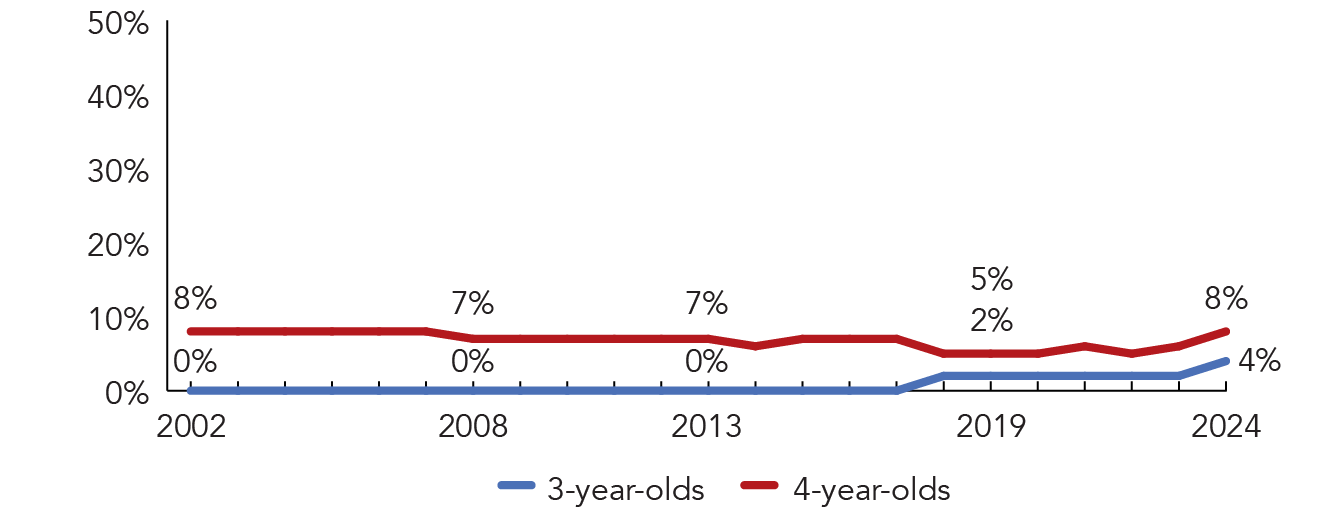
4-year-Olds
42
3-year-Olds
25
Resource Rankings
State spending
8
All reported spending
12
Total Benchmarks Met
Of 10 benchmarks possible
9*
Overview
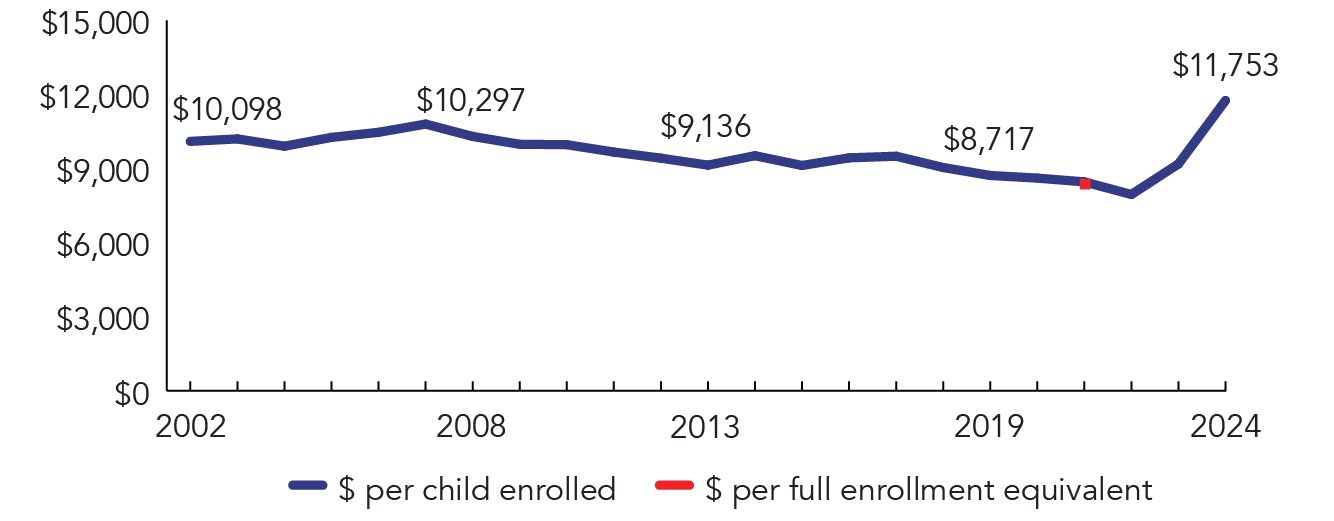
During the 2023-2024 school year, Delaware preschool enrolled 1,238 children, an increase of 284 from the prior year. State spending totaled $14,550,750, up $5,790,112 (66%), adjusted for inflation, since last year. State spending per child averaged $11,753 in 2023- 2024, up $2,570 from 2022-2023, adjusted for inflation. Full-day preschool seats are funded at $14,500 and half-day seats are funded at $7,250. Delaware met 9 of 10 quality standards benchmarks.
What's New
The State-funded Early Care and Education Program (SFECEP) blends the Early Childhood Assistance Program (ECAP) and the Redding Consortium funding streams, both of which are state funding streams. In 2023-2024, children under three years old became eligible to participate in Delaware’s Early Care and Education Program (SFECEP), as well as a new pilot including one Family Child Care Provider, though it was not included in this report because it was serving an infant. A revised Quality Improvement System
was launched July of 2023 with state funded programs receiving targeted support in the form of training, coaching, and technical assistance. In winter 2023, the ECEP went out to Request for Proposal (RFP). Programs needed to plan for potential changes to their state contract and programming during the 2022-2023 school year, in anticipation of program changes outlined in the RFP.
Background
The Delaware Early Childhood Assistance Program (ECAP) began in 1994, providing comprehensive early learning services for 4-yearolds eligible for the federal Head Start program. Eligibility expanded to 3-year-olds in 2017-2018.
Originally modeled after the federal Head Start program, SFECEP requires participating programs to follow a statewide policies and procedures manual with required standards. Per these standards, ten percent of enrollment slots are reserved for children with disabilities; the majority of participating children must live in families with incomes at or below 100% FPL. Up to 35% of enrolled children may live in households up to 130% FPL.
SFECEP awards are available to private and public child care programs, such as for-profit child care, Head Start agencies, public schools, community-based organizations, and faith-based centers through an RFP process. Contracts for funded SFECEP seats are determined based on Community Needs Assessment Data.
Delaware Early Care And Education Programs
Access
| |
| Total state pre-K enrollment | 1,238 |
| School districts that offer state program | 47% |
| Income requirement | 100% FPL |
| Minimum hours of operation | 3.5 hours/day; 5 days/week |
| Operating schedule | 170 days/year |
| Special education enrollment, ages 3 and 4 | 2,520 |
| Federally funded Head Start enrollment, ages 3 and 4 | 1,013 |
| State-funded Head Start enrollment, ages 3 and 4 | 0 |
Resources
| Total state pre-K spending | $14,550,750 |
| Local match required? | No |
| State Head Start spending | $0 |
| State spending per child enrolled | $11,753 |
| All reported spending per child enrolled* | $11,753 |
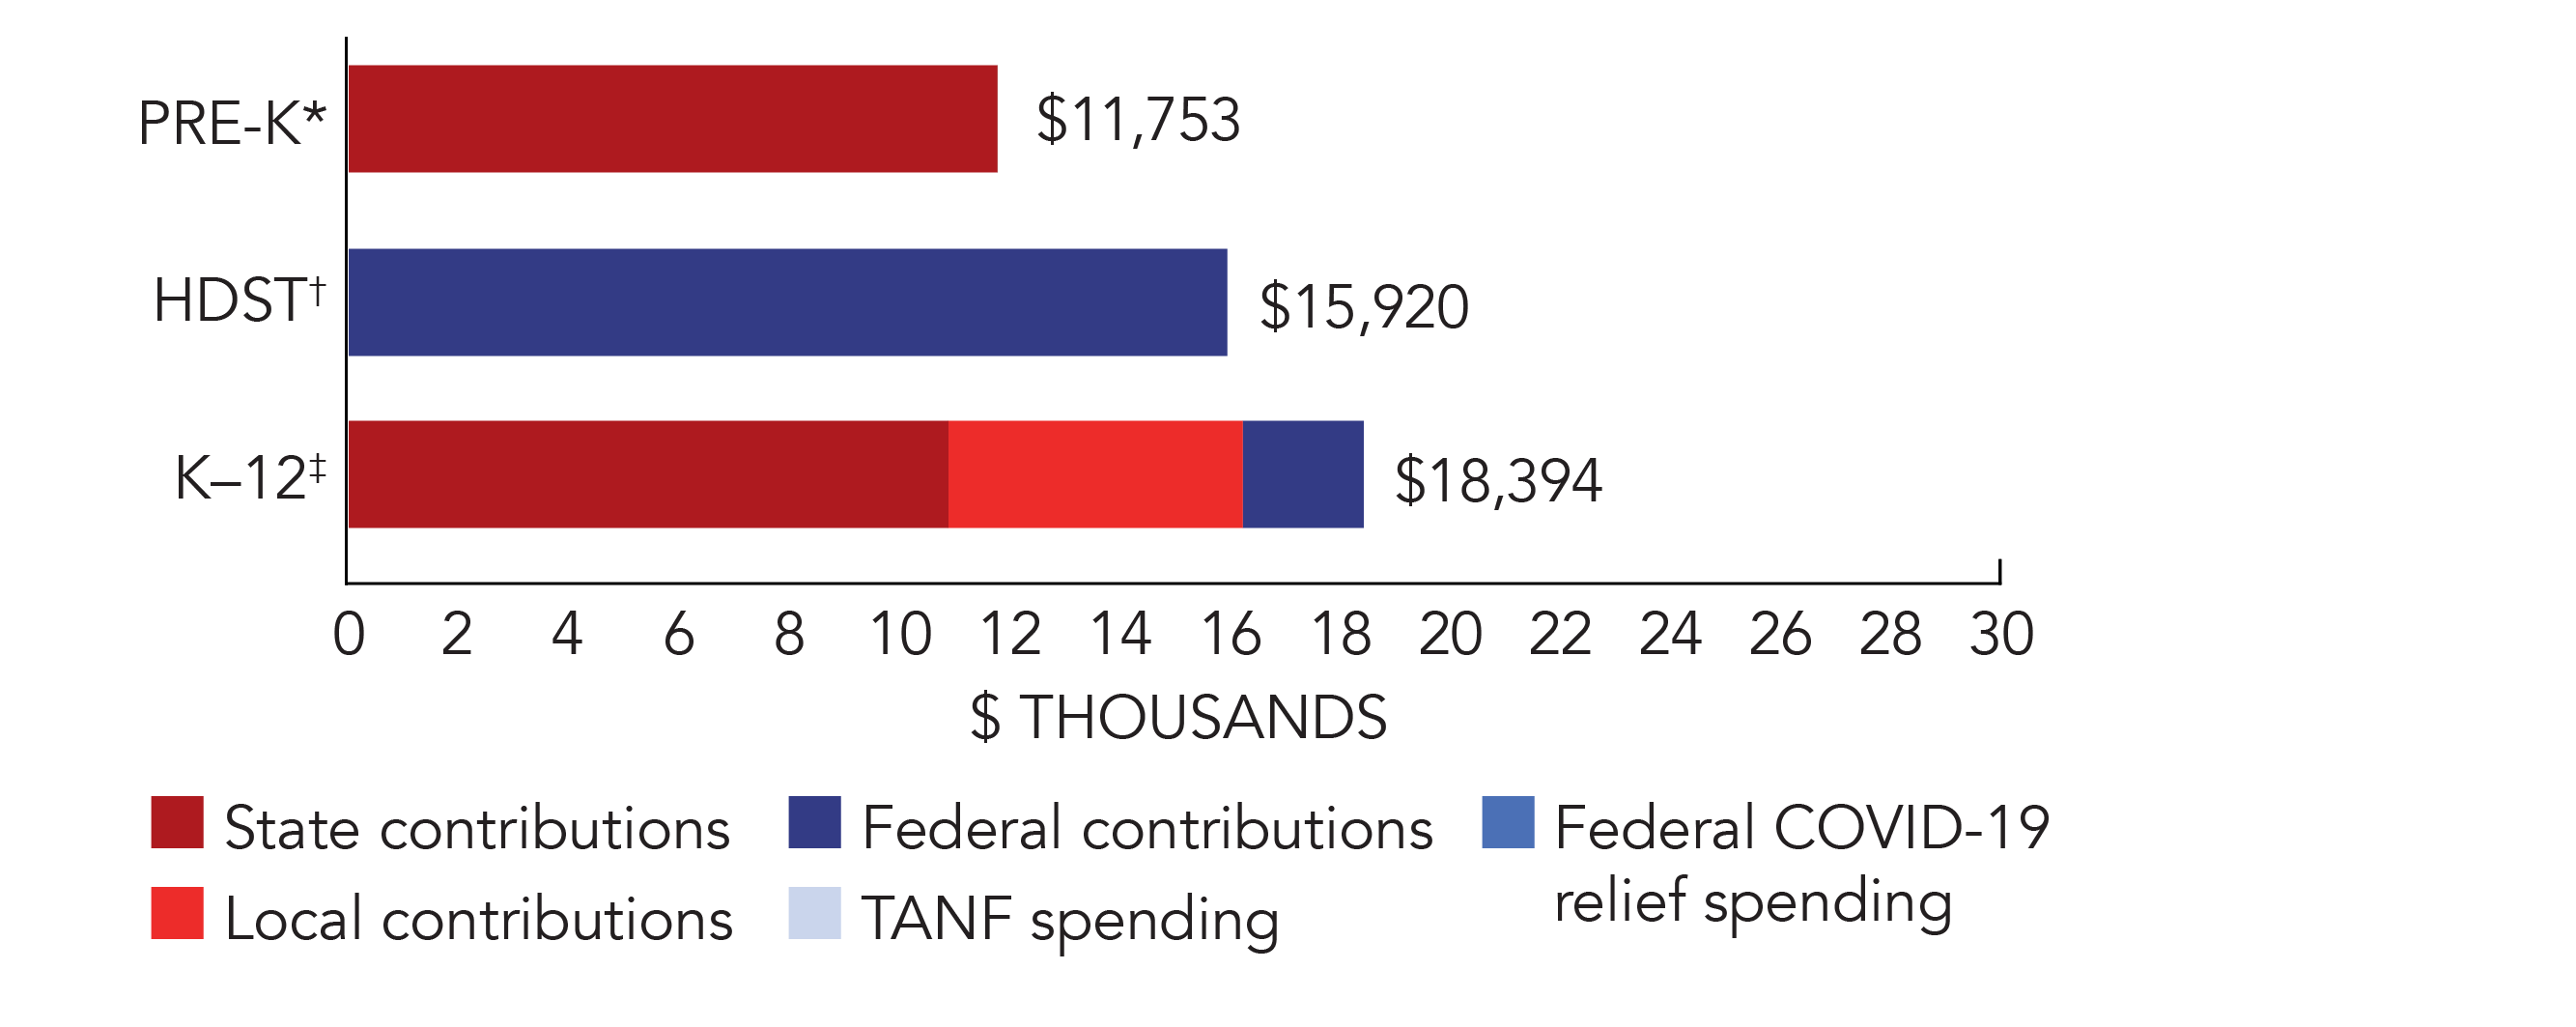
*Pre-K programs may receive additional funds from federal or local sources that are not included in this figure. †Head Start per-child spending includes funding only for 3- and 4-year-olds. ‡K–12 expenditures include capital spending as well as current operating expenditures.
Delaware Quality Standards Checklist
| Policy | Requirement | Benchmark | Meets Benchmark? |
|---|---|---|---|
For more information about the benchmarks, see the Executive Summary and the Roadmap to State pages. | 9*benchmarks met | ||
| Early Learning & Development Standards Benchmark | Comprehensive, aligned, supported, culturally sensitive | Comprehensive, aligned, supported, culturally sensitive | |
| Curriculum Supports Benchmark | Approval process & supports | Approval process & supports | |
| Teacher Degree Benchmark | BA (public); At least AA with 50% BA (nonpublic) | BA | |
| Teacher Specialized Training Benchmark | ECE, CD, ECE SpEd | Specializing in pre-K | |
| Assistant Teacher Degree Benchmark | Working towards CDA or equivalent | CDA or equivalent | |
| Staff Professional Development Benchmark | 90 hours/5 years (public teachers); 18 hours/year (nonpublic teachers & assistants); 15 hours/year (public assistants); PD plans; Coaching | For teachers & assistants: At least 15 hours/year; individual PD plans; coaching | |
| Maximum Class Size Benchmark | 17 (3-year-olds); 20 (4-year-olds) | 20 or lower | |
| Staff to Child Ratio Benchmark | 2:17 (3-year-olds); 1:10 (4-year-olds) | 1:10 or better | |
| Screening & Referral Benchmark | Vision, hearing, health & more | Vision, hearing & health screenings; & referral | |
| Continuous Quality Improvement System Benchmark | Structured classroom observations; Data used for program improvement* | Structured classroom observations; data used for program improvement | |
* Indicates that while policy meets the benchmark, it is not being implemented fully