State of Preschool
Connecticut
Access Rankings
4-year-Olds
36
3-year-Olds
11
Resource Rankings
State spending
12
All reported spending
23
Total Benchmarks Met
Of 10 benchmarks possible
5.1
Overview
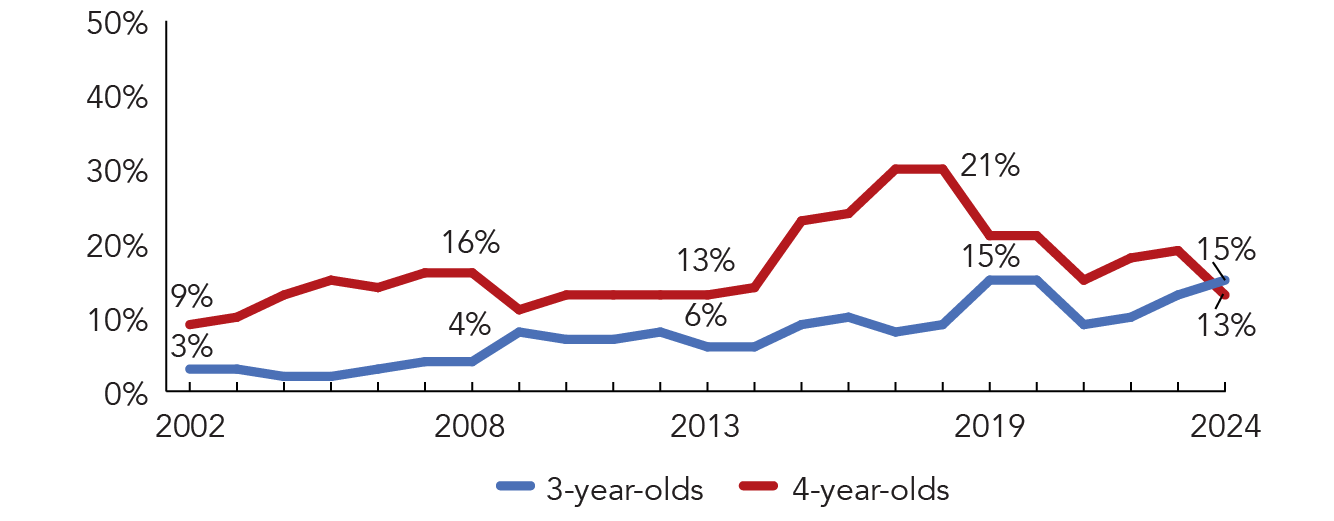
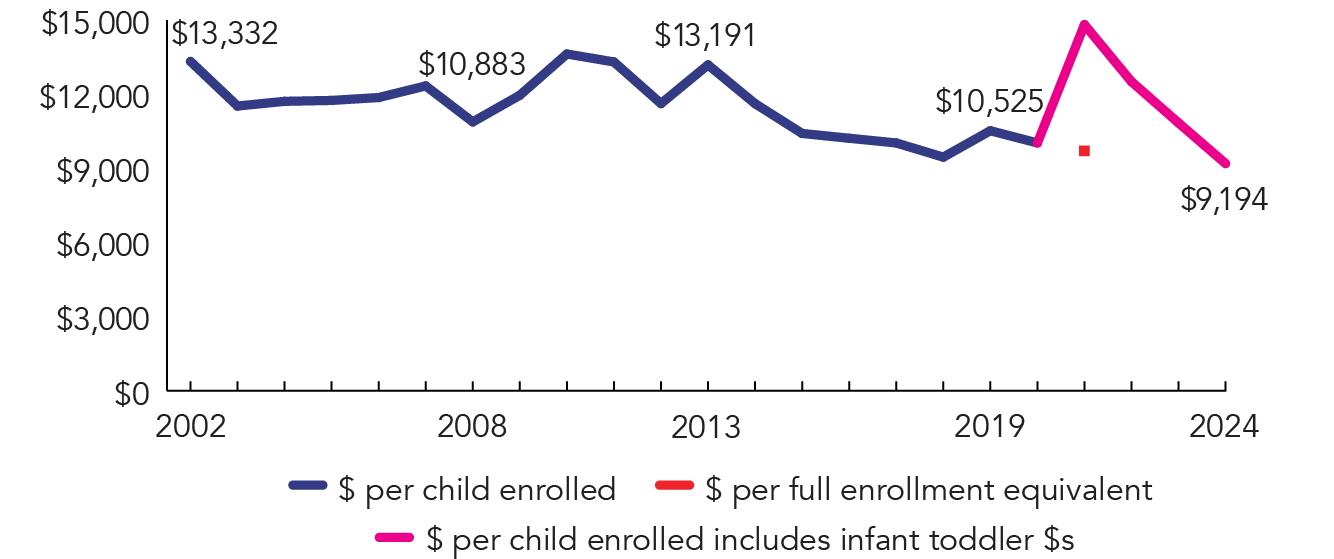
During the 2023-2024 school year, Connecticut preschool enrolled 12,333 children, a decrease of 537 from the prior year. State spending totaled $113,392,552, and state spending per child equaled $9,194 in 2023-2024. The CT Legislature approved level funding for all state funded preschool programs and maintained the same per pupil spending rates for the different available space types. Variations in final totals and per pupil spending as reported by NIEER are generally based upon utilization. Connecticut met an average of 5.1 of 10 quality standards benchmarks. The pink colored line on the spending per child enrolled figure reflects the years in which spending reported on the CDCC program included infant and toddler slots.
What's New
In July of 2025, the Office of Early Childhood (OEC) will consolidate multiple funding streams under Early Start CT to provide state funding to early care and education programs throughout the state and coordinate and facilitate the efficient delivery of such early care and education programs for eligible children. Under Early Start CT OEC will expand opportunities and services for young children including:
- Provide streamlined access for eligible infants and toddlers and preschool-age children to high-quality early care and education programs that promote the health and safety of children and prepare them for school.
- Strengthen the family through encouragement of family and community engagement and partnership in a child’s development and education, and enhancement of parent voice at local governance tables.
- Assure that children with disabilities are integrated into early care and education programs available to children who do not have disabilities.
Background
Connecticut serves prekindergarten children in three state-funded programs: School Readiness Program (SR), Child Day Care Contracts (CDCC), and Smart Start, all supervised by the OEC. Non-Head Start SR, CDCC, and Smart Start programs have three years to become NAEYC accredited. Programs not NAEYC accredited or Head Start approved are required to have annual Early Childhood Environment Rating Scale (ECERS) ratings by state-approved raters to help prepare them for accreditation.
Connecticut has provided funding for CDCC for over 40 years through a purchase-of-service contracting system. The services provided through the CDCC are supported through state funds and must operate for at least 10 hours per day. Eligibility requirements target children with household incomes below 75% SMI for state funding CDCC programs, which must be licensed as a child care facility by the state, may operate under the contract held by an elementary or secondary school, nursery school, preschool, day care center, group child care home, family child care home, family resource center, Head Start program, or local or regional board of education.
School Readiness was founded in 1997 to expand access to early childhood programs for 3- and 4-year-olds. Financial support is available to 21 Priority School Readiness districts, as defined by legislation, and 46 Competitive School Readiness municipalities that have at least one school in which 40% or more of children are eligible for free or reduced-price lunch or fall within the 50 lowest wealth-ranked towns in the state. Any family can apply for School Readiness spaces in designated Priority or Competitive municipalities; however, 60% of children enrolled in each municipality must meet the income guideline of at-or-below 75% of the SMI.
Smart Start was created during the 2014 legislative session to expand publicly funded preschool in public school settings. Funding is distributed to local or regional boards of education through a competitive grant process.
Connecticut’s overall support for state-funded preschool, including enrollment and funding for CDCC, SR, and Smart Start, is depicted in the first two pages of the state profile. The third page focuses solely on CDCC, the fourth on SR, and the fifth on Smart Start.
-
Access

Total state pre-K enrollment 12,333 Special education enrollment, ages 3 and 4 7,070 Federally funded Head Start enrollment, ages 3 and 4 3,773 State-funded Head Start enrollment, ages 3 and 4 237 Resources
Total state pre-K spending $113,392,552 State Head Start spending $5,083,238 State spending per child enrolled $9,194 All reported spending per child enrolled* $9,194 
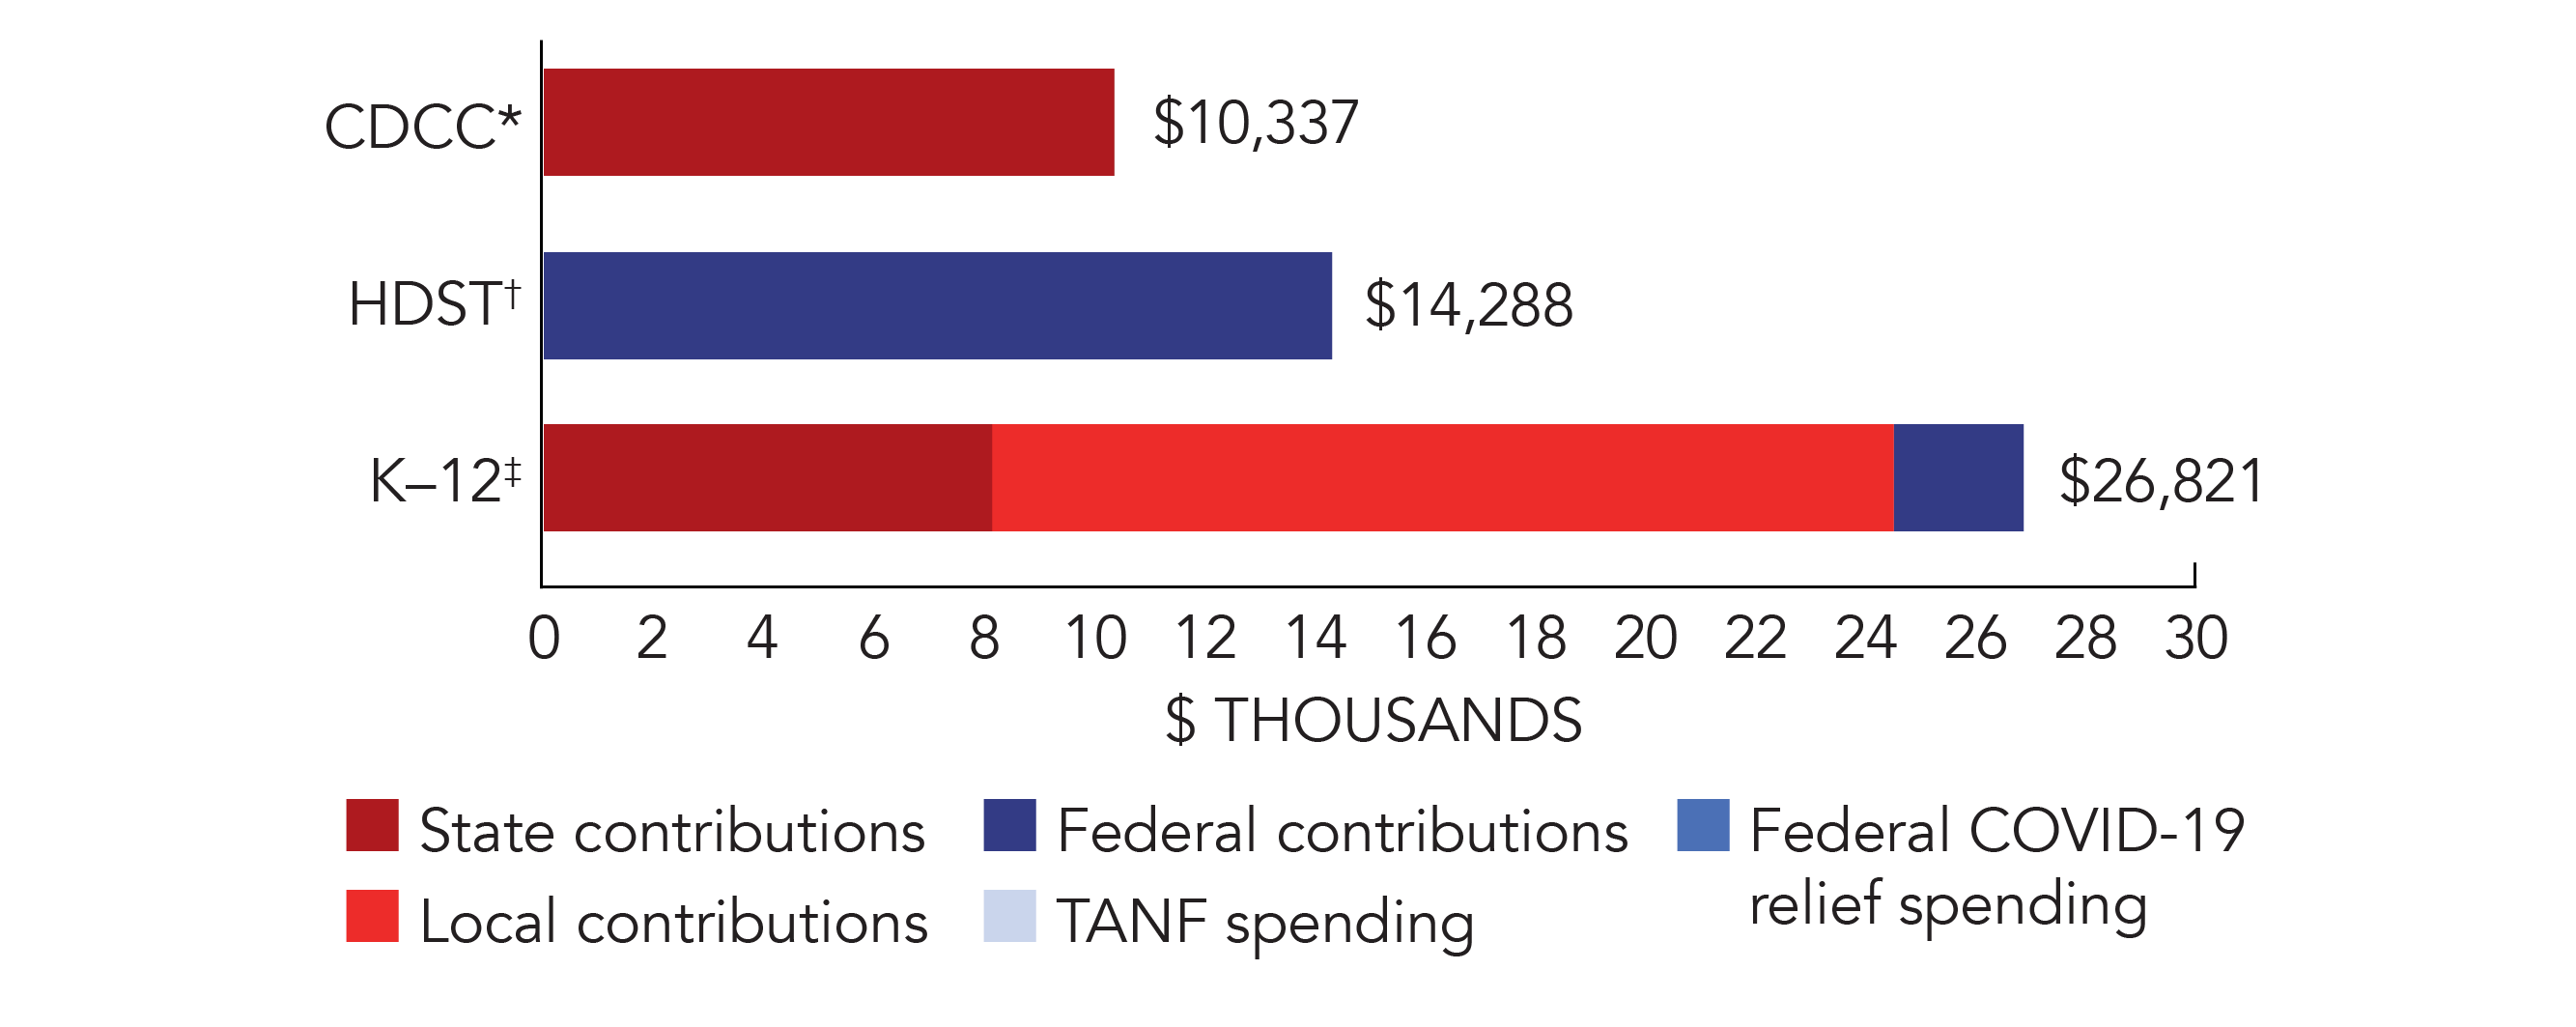
*Pre-K programs may receive additional funds from federal or local sources that are not included in this figure. †Head Start per-child spending includes funding only for 3- and 4-year-olds. ‡K–12 expenditures include capital spending as well as current operating expenditures.

-
Access

Total state pre-K enrollment 1,609 School districts that offer state program 28% (towns/communities) Income requirement 75% SMI (60% families) Minimum hours of operation 10 hours/day; 5 days/week Operating schedule Full calendar year Resources
Total state pre-K spending $16,632,520 Local match required? No State spending per child enrolled $10,337 All reported spending per child enrolled* $10,337 
*Pre-K programs may receive additional funds from federal or local sources that are not included in this figure. †Head Start per-child spending includes funding only for 3- and 4-year-olds. ‡K–12 expenditures include capital spending as well as current operating expenditures.
Connecticut Child Day Care Contracts (CDCC) Quality Standards Checklist
| Policy | CT CDCC Requirement | Benchmark | Meets Benchmark? |
|---|---|---|---|
For more information about the benchmarks, see the Executive Summary and the Roadmap to State pages. | 5benchmarks met | ||
| Early Learning & Development Standards Benchmark | Comprehensive, aligned, supported, culturally sensitive | Comprehensive, aligned, supported, culturally sensitive | |
| Curriculum Supports Benchmark | Approval process & supports | Approval process & supports | |
| Teacher Degree Benchmark | AA in ECE (at least 50% of teachers); CDA plus 12 ECE credits (other teachers) | BA | |
| Teacher Specialized Training Benchmark | AA in ECE (at least 50% of teachers); CDA plus 12 ECE credits (other teachers) | Specializing in pre-K | |
| Assistant Teacher Degree Benchmark | No minimum education degree | CDA or equivalent | |
| Staff Professional Development Benchmark | PD: 1% of total work hours; PD plans (some teachers) | For teachers & assistants: At least 15 hours/year; individual PD plans; coaching | |
| Maximum Class Size Benchmark | 20 (3- & 4-year-olds) | 20 or lower | |
| Staff to Child Ratio Benchmark | 1:10 (3- & 4-year-olds) | 1:10 or better | |
| Screening & Referral Benchmark | Vision, hearing, health & more; Referrals not required | Vision, hearing & health screenings; & referral | |
| Continuous Quality Improvement System Benchmark | Structured classroom observations (per Head Start and NAEYC accreditation requirements); Data used for program improvement | Structured classroom observations; data used for program improvement | |
-
Access
Total state pre-K enrollment 10,075 School districts that offer state program 40% (towns/communities) Income requirement 75% SMI (60% families) Minimum hours of operation 2.5 hours/day; 5 days/week Operating schedule Determined locally Resources
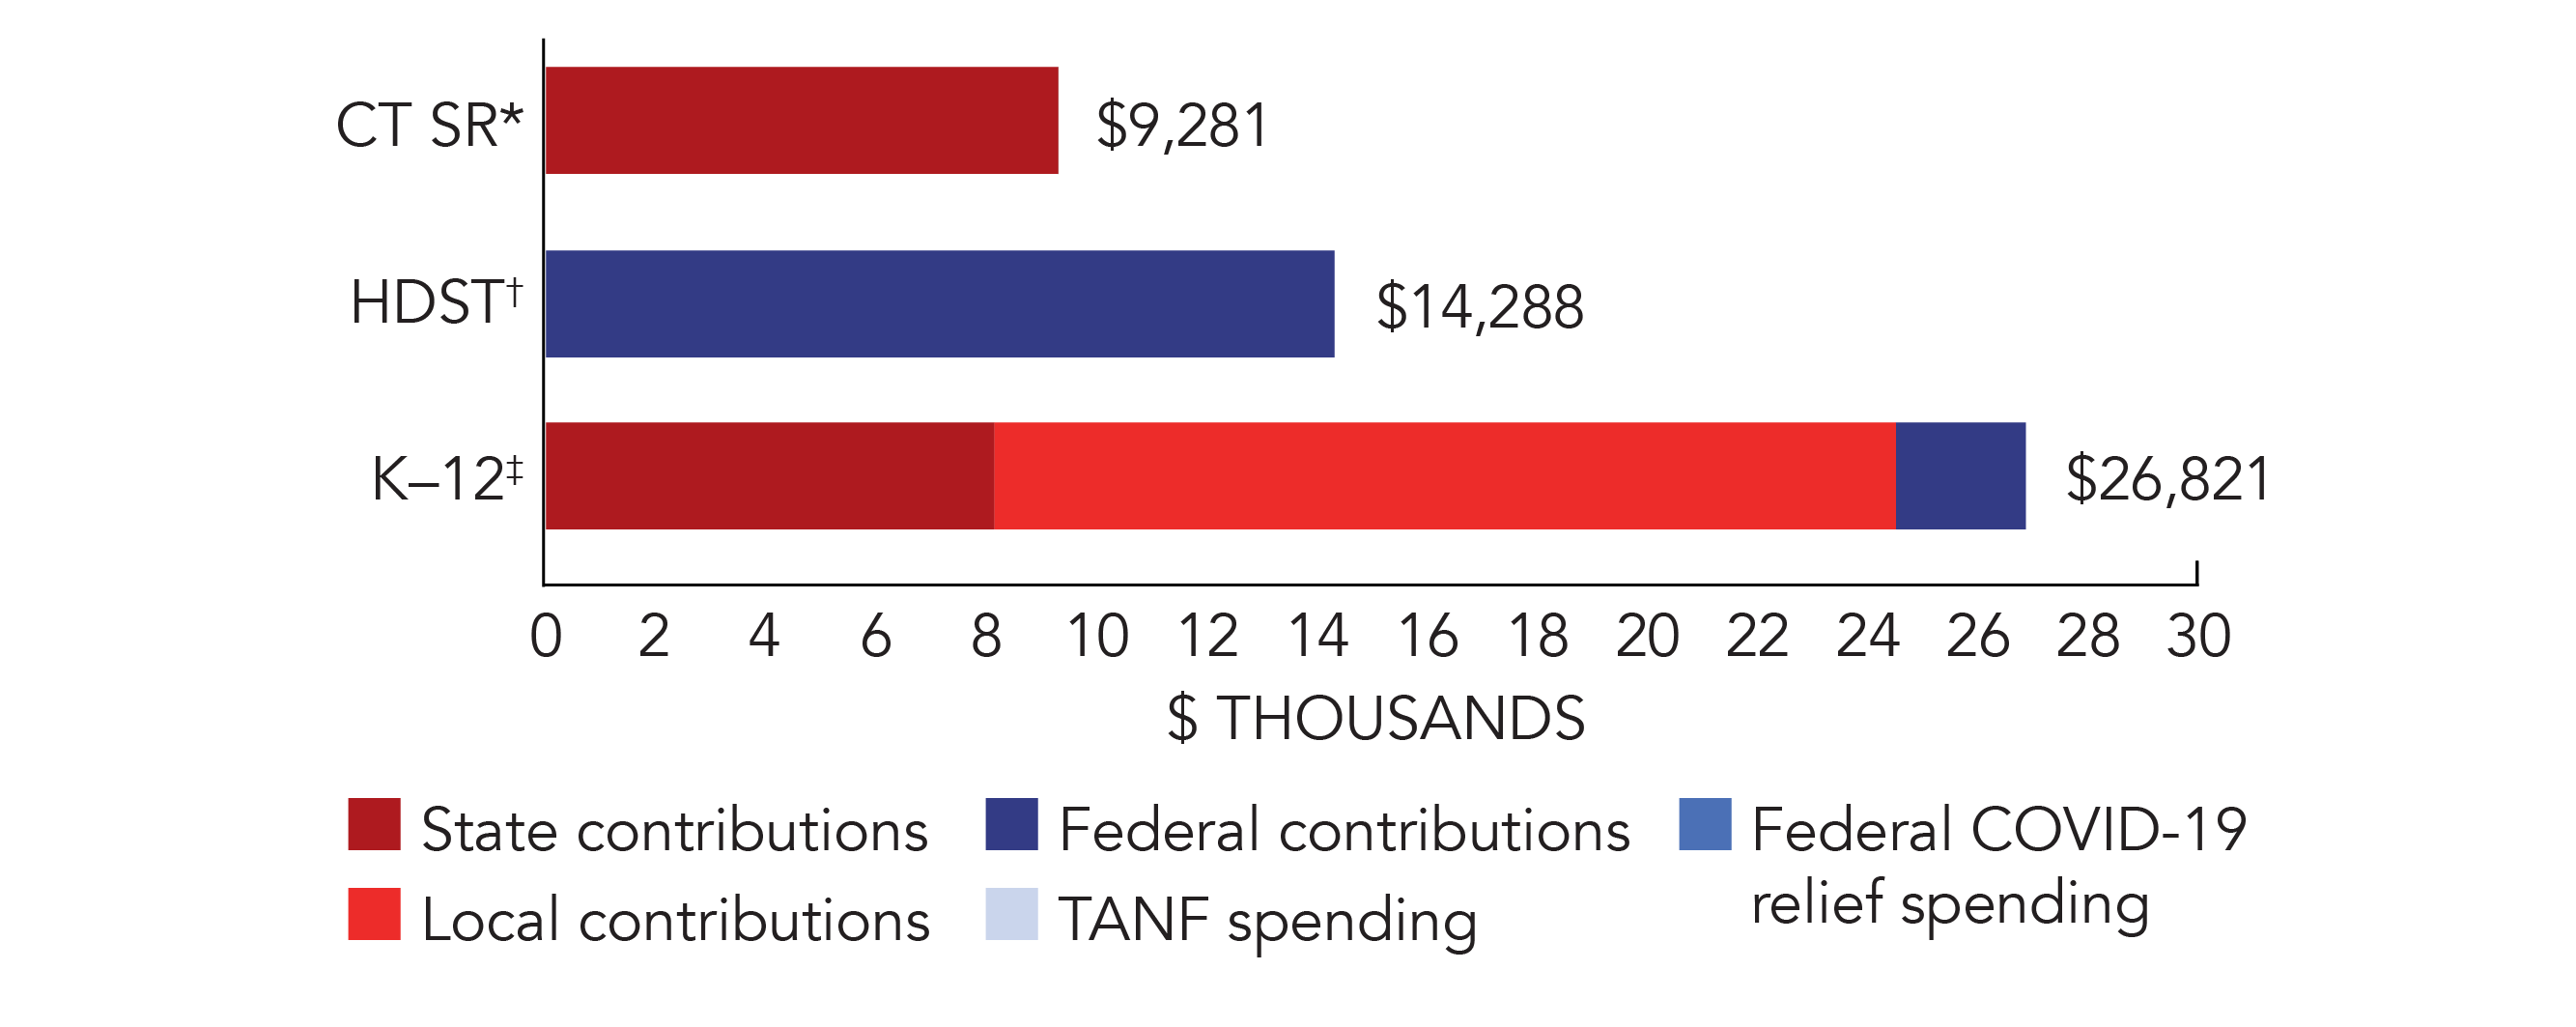
Total state pre-K spending $93,510,032 Local match required? No State spending per child enrolled $9,281 All reported spending per child enrolled* $9,281 
*Pre-K programs may receive additional funds from federal or local sources that are not included in this figure. †Head Start per-child spending includes funding only for 3- and 4-year-olds. ‡K–12 expenditures include capital spending as well as current operating expenditures.
Connecticut School Readiness (SR) Quality Standards Checklist
| Policy | CT SR Requirement | Benchmark | Meets Benchmark? |
|---|---|---|---|
For more information about the benchmarks, see the Executive Summary and the Roadmap to State pages. | 5benchmarks met | ||
| Early Learning & Development Standards Benchmark | Comprehensive, aligned, supported, culturally sensitive | Comprehensive, aligned, supported, culturally sensitive | |
| Curriculum Supports Benchmark | Approval process & supports | Approval process & supports | |
| Teacher Degree Benchmark | AA in ECE (at least 50% of teachers); CDA plus 12 ECE credits (other teachers) | BA | |
| Teacher Specialized Training Benchmark | AA in ECE (at least 50% of teachers); CDA plus 12 ECE credits (other teachers) | Specializing in pre-K | |
| Assistant Teacher Degree Benchmark | No minimum education degree | CDA or equivalent | |
| Staff Professional Development Benchmark | PD: 1% of total work hours; PD plans (some teachers) | For teachers & assistants: At least 15 hours/year; individual PD plans; coaching | |
| Maximum Class Size Benchmark | 20 (3- & 4-year-olds) | 20 or lower | |
| Staff to Child Ratio Benchmark | 1:10 (3- & 4-year-olds) | 1:10 or better | |
| Screening & Referral Benchmark | Vision, hearing, health & more; Referrals not required | Vision, hearing & health screenings; & referral | |
| Continuous Quality Improvement System Benchmark | Structured classroom observations (per Head Start and NAEYC accreditation requirements); Data used for program improvement | Structured classroom observations; data used for program improvement | |
-
Access
Total state pre-K enrollment 649 School districts that offer state program 14% (towns/communities) Income requirement 75% SMI (60% of families) Minimum hours of operation 6 hours/day; 5 days/week Operating schedule School or academic year Resources
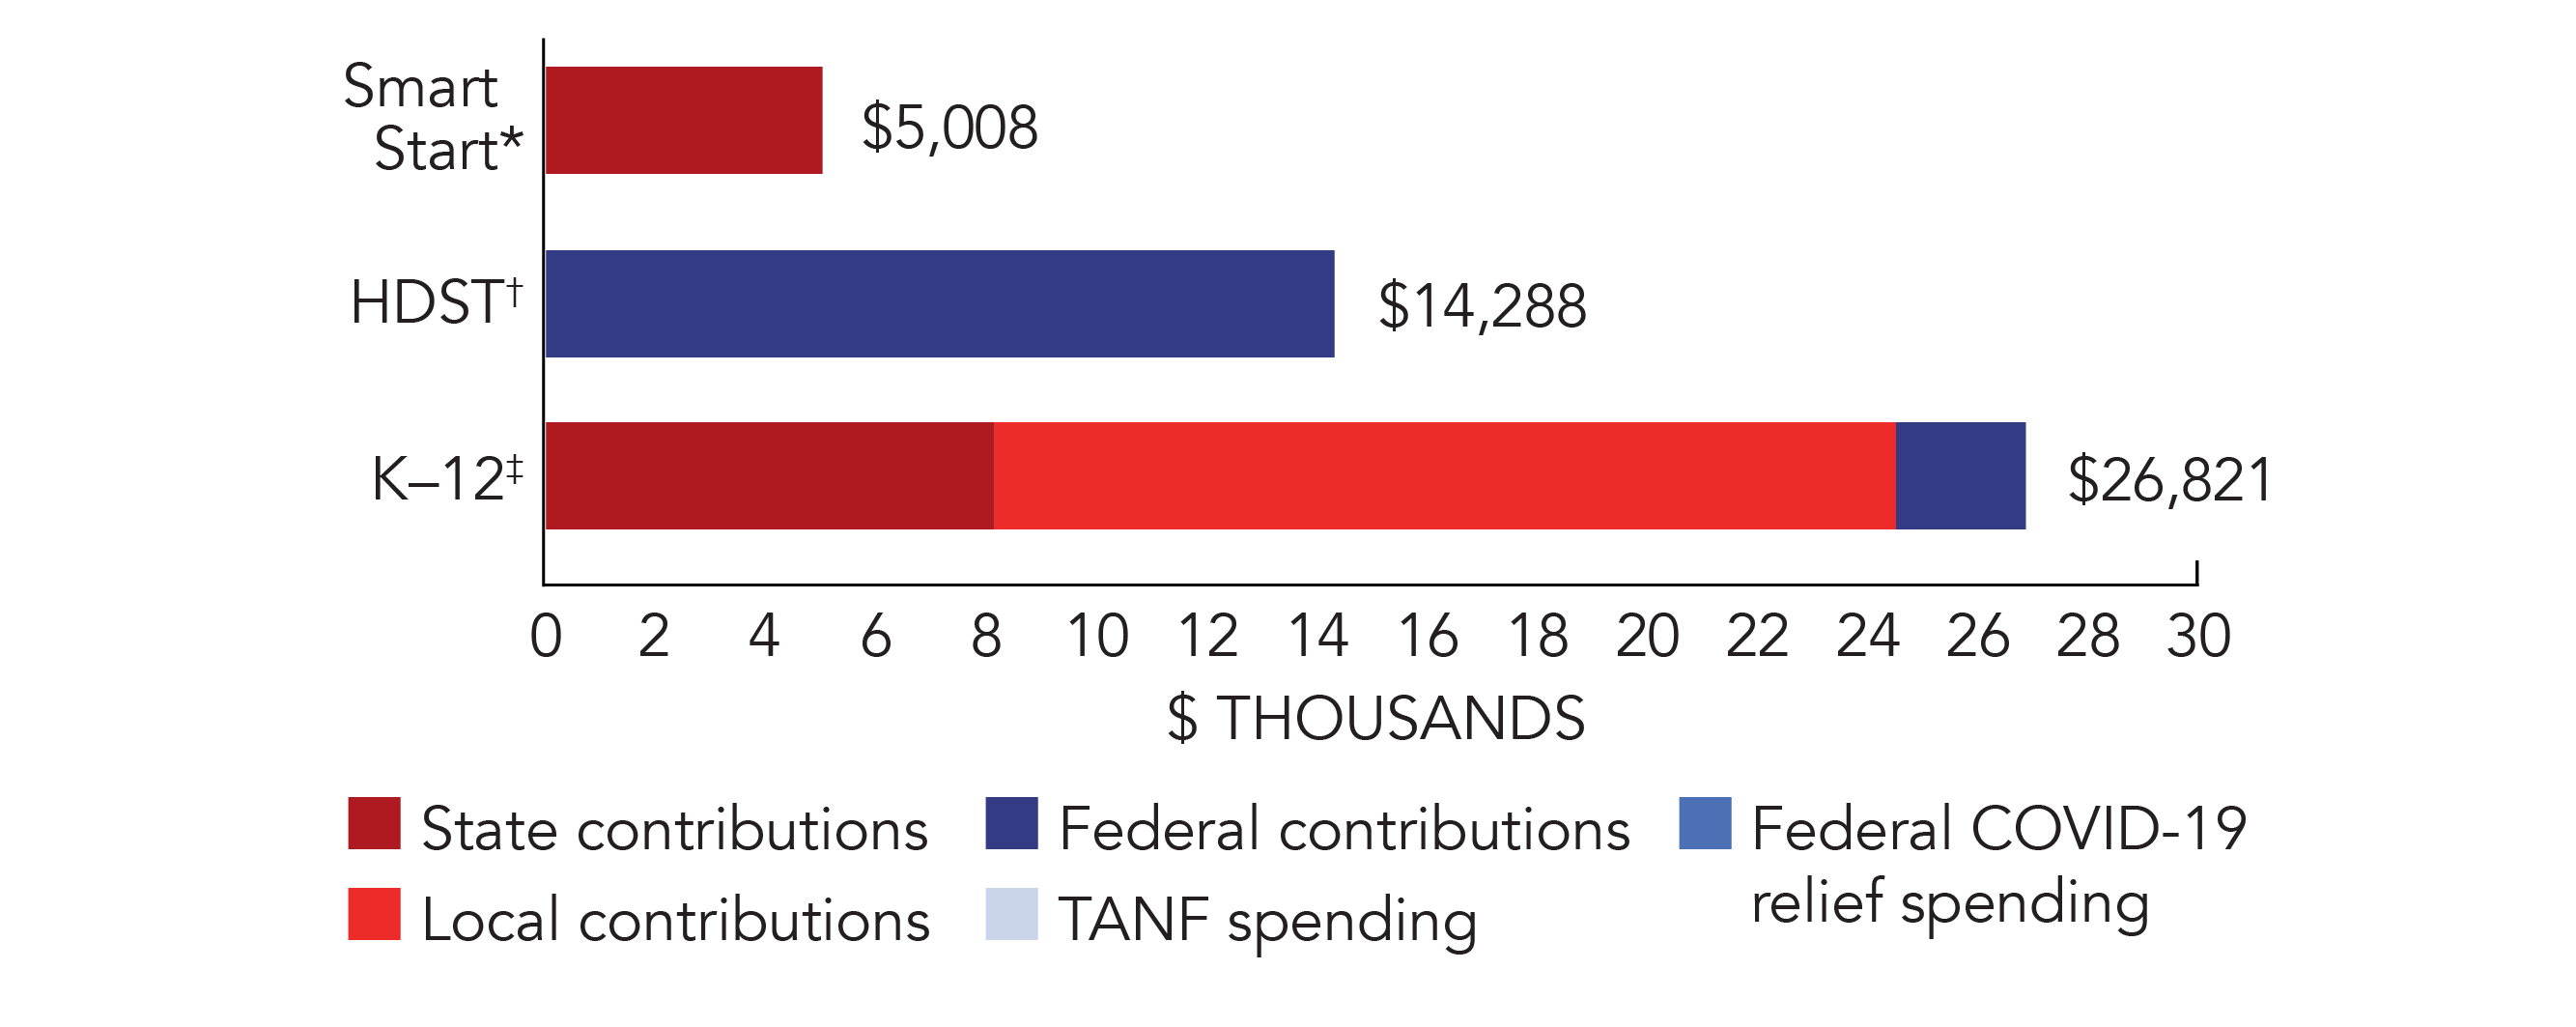
Total state pre-K spending $3,250,000 Local match required? No State spending per child enrolled $5,008 All reported spending per child enrolled* $5,008 
*Pre-K programs may receive additional funds from federal or local sources that are not included in this figure. †Head Start per-child spending includes funding only for 3- and 4-year-olds. ‡K–12 expenditures include capital spending as well as current operating expenditures.
Connecticut Smart Start Quality Standards Checklist
| Policy | CT Smart Start Requirement | Benchmark | Meets Benchmark? |
|---|---|---|---|
For more information about the benchmarks, see the Executive Summary and the Roadmap to State pages. | 6benchmarks met | ||
| Early Learning & Development Standards Benchmark | Comprehensive, aligned, supported, culturally sensitive | Comprehensive, aligned, supported, culturally sensitive | |
| Curriculum Supports Benchmark | Approval process & supports | Approval process & supports | |
| Teacher Degree Benchmark | BA | BA | |
| Teacher Specialized Training Benchmark | ECE, ECE SpEd | Specializing in pre-K | |
| Assistant Teacher Degree Benchmark | HSD | CDA or equivalent | |
| Staff Professional Development Benchmark | PD plans (teachers only) | For teachers & assistants: At least 15 hours/year; individual PD plans; coaching | |
| Maximum Class Size Benchmark | 18 (3- & 4-year-olds) | 20 or lower | |
| Staff to Child Ratio Benchmark | 1:9 (3- & 4-year-olds) | 1:10 or better | |
| Screening & Referral Benchmark | Vision, hearing, health & more; Referrals not required | Vision, hearing & health screenings; & referral | |
| Continuous Quality Improvement System Benchmark | Structured classroom observations (per Head Start and NAEYC accreditation requirements); Data used for program improvement | Structured classroom observations; data used for program improvement | |